Wildpulse Map
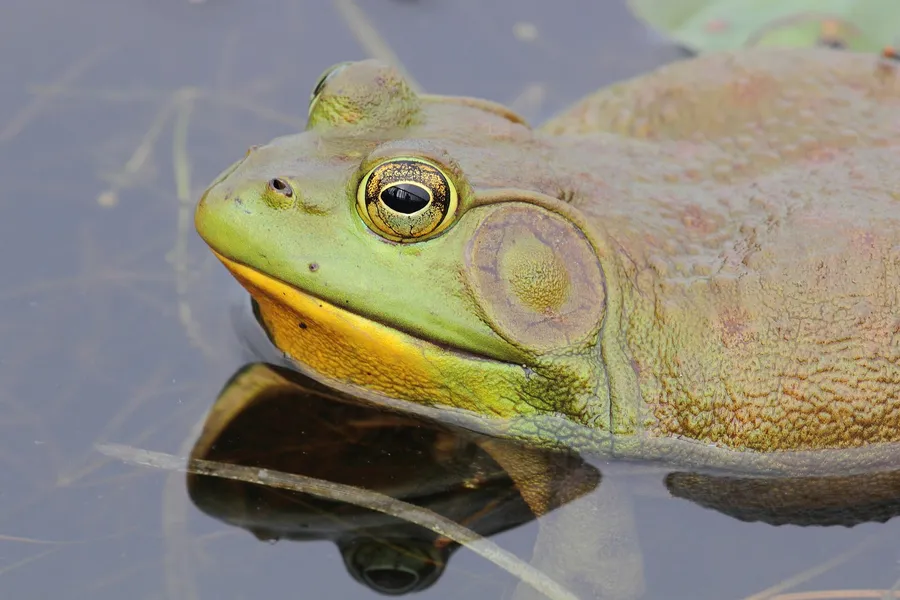
Photo: American Bullfrog

American Bullfrog

Lithobates catesbeianus

The American bullfrog is a very large, heavy-bodied frog native to North America that can reach about 20 cm from snout to vent. It lives in swamps, ponds, lakes and other permanent water. Its name comes from the deep call of breeding males, which sounds like a bellowing bull. It eats almost anything it can overpower, including insects, fish, other frogs, snails, young birds and small mammals. Introduced to many parts of the world, it is considered invasive there because it preys on and outcompetes native amphibians.

In our data the species was reported on 10,111 days in 25 countries, most often in the USA, Canada and Belgium.

Last reported on November 21, 2026 in the USA (Michigan)

View on the map

Photo: Cephas, CC BY-SA 3.0

Where the species lives and is reported

Drag to turn the globe

Where it is reported

Most reports come from North America (78 %), from Europe (16 %) and from Asia (3 %).

Counted are reporting days: days on which the species was reported at least once in a cell.

Where it was reported

Each hexagon is a cell about 40 km across in which people reported the species. The darker, the more days.

  • 10,111reporting days
  • 1,560cells
  • 25countries

Where it stays pale, few reports come in. That does not mean the species is absent there. The latest reports pulse:

  • Michigan, USA
  • Rio Grande do Sul, Brazil
  • Pennsylvania, USA
  • Tochigi Prefecture, Japan

Where it is reported most often

For each country, the place where the species was reported on the most days. Tap a place.

This is no promise. It shows where people report it especially often.

Through the year

The species is most likely to be reported in July (44 % more often than the yearly average), least often in February (67 % less often). The bars show the difference from the yearly average, adjusted for the fact that more people are outdoors in summer. On the map, a cell is darker the more of its reports fall in the month shown.

January: 66 % less often than the yearly average.

When is the species reported where?

Green means: in this month the species is reported there clearly more often than in the rest of the year. Blue means: clearly less often. We have adjusted for the fact that more people are outdoors in summer. Tap a square.

How often the species is reported per country and month, compared with the yearly average
CountryJFMAMJJASOND
All countriesreported 66 % less often than the yearly averagereported 67 % less often than the yearly averagereported 54 % less often than the yearly averagereported 17 % less often than the yearly averagereported 21 % more often than the yearly averagereported 37 % more often than the yearly averagereported 44 % more often than the yearly averagereported 35 % more often than the yearly averagereported 17 % more often than the yearly averagereported 30 % less often than the yearly averagereported 47 % less often than the yearly averagereported 64 % less often than the yearly average
USAreported 74 % less often than the yearly averagereported 57 % less often than the yearly averagereported 33 % less often than the yearly averagereported about as often as the yearly averagereported 26 % more often than the yearly averagereported 20 % more often than the yearly averagereported 22 % more often than the yearly averagereported 11 % more often than the yearly averagereported 15 % more often than the yearly averagereported 27 % less often than the yearly averagereported 43 % less often than the yearly averagereported 71 % less often than the yearly average
Canadareported about as often as the yearly averageno clear difference from the yearly averagereported 75 % less often than the yearly averagereported 49 % less often than the yearly averagereported about as often as the yearly averagereported 37 % more often than the yearly averagereported 24 % more often than the yearly averagereported 23 % more often than the yearly averagereported 31 % less often than the yearly averagereported 56 % less often than the yearly averagereported 80 % less often than the yearly averageno clear difference from the yearly average
Belgiumno clear difference from the yearly averagereported 94 % less often than the yearly averagereported 98 % less often than the yearly averagereported 79 % less often than the yearly averageno clear difference from the yearly averagereported 62 % more often than the yearly averagereported 2.1 times as often as the yearly averagereported 70 % more often than the yearly averageno clear difference from the yearly averagereported 57 % less often than the yearly averageno clear difference from the yearly averageno clear difference from the yearly average
Franceno clear difference from the yearly averageno reportsreported 82 % less often than the yearly averagereported 71 % less often than the yearly averageno clear difference from the yearly averagereported 2.4 times as often as the yearly averagereported 3.3 times as often as the yearly averagereported 3.6 times as often as the yearly averagereported 75 % more often than the yearly averagereported 76 % less often than the yearly averageno reportsno reports
Netherlandsno clear difference from the yearly averageno reportsno reportsreported 74 % less often than the yearly averagereported about as often as the yearly averagereported 93 % more often than the yearly averagereported 41 % more often than the yearly averagereported 47 % more often than the yearly averagereported 94 % more often than the yearly averageno clear difference from the yearly averageno clear difference from the yearly averageno clear difference from the yearly average
Japanno clear difference from the yearly averageno clear difference from the yearly averageno clear difference from the yearly averageno clear difference from the yearly averageno clear difference from the yearly averagereported about as often as the yearly averageno clear difference from the yearly averageno clear difference from the yearly averageno clear difference from the yearly averagereported about as often as the yearly averageno clear difference from the yearly averageno clear difference from the yearly average
Brazilreported about as often as the yearly averageno clear difference from the yearly averageno clear difference from the yearly averagereported about as often as the yearly averageno clear difference from the yearly averagereported about as often as the yearly averagereported about as often as the yearly averagereported about as often as the yearly averagereported about as often as the yearly averageno clear difference from the yearly averagereported about as often as the yearly averagereported about as often as the yearly average
South Koreano clear difference from the yearly averagereported 87 % less often than the yearly averageno clear difference from the yearly averagereported about as often as the yearly averageno clear difference from the yearly averageno clear difference from the yearly averagereported about as often as the yearly averageno clear difference from the yearly averagereported 2.1 times as often as the yearly averagereported about as often as the yearly averageno clear difference from the yearly averageno clear difference from the yearly average
much less oftenless oftenno clear differencemore oftenmuch more often

In the USA in May: reported 26 % more often than the yearly average. This is the strongest month there.

Who is reported in the same cells

In how many of 10 areas of this species the other species was reported as well. Counted are the 677 cells in which this species is reported regularly; compared with the other species that have a page.

Latest reports on the map

The map shows every cell with reports of this species, including the latest ones, and every other species as well.

View the American Bullfrog on the map