Wildpulse Map
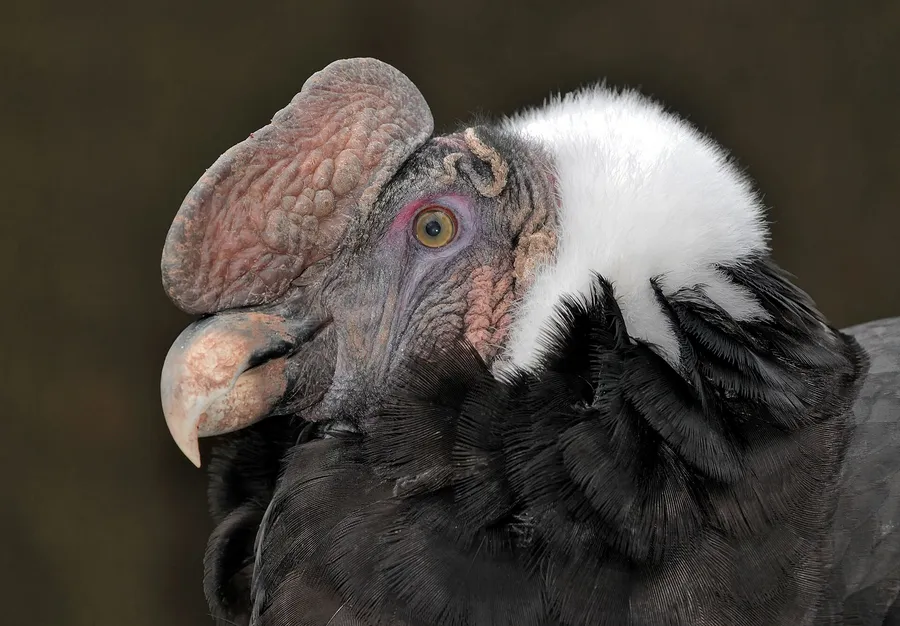
Photo: Andean Condor

Andean Condor

Vultur gryphus

The Andean condor is a huge black New World vulture with a ruff of white feathers around the neck and large white wing patches. With a wingspan of over three metres, it is one of the largest flying birds. It lives in the Andes and along the adjacent Pacific coast of South America and feeds mainly on carrion, which it spots while soaring on broad, flat-held wings. Some condors live for more than 70 years, and a pair usually raises a single chick only every second year.

In our data the species was reported on 40,775 days in 7 countries, most often in Argentina, Chile and Ecuador.

Last reported on November 18, 2026 in Chile (Santiago)

View on the map

Photo: Michael Gäbler, CC BY 3.0

Size and way of life

Wingspan
3.05 mfrom wingtip to wingtip

Where the species lives and is reported

Drag to turn the globe

Where it is reported

Most reports come from South America (100 %).

Counted are reporting days: days on which the species was reported at least once in a cell.

Where it was reported

Each hexagon is a cell about 40 km across in which people reported the species. The darker, the more days.

  • 40,775reporting days
  • 1,079cells
  • 7countries

Where it stays pale, few reports come in. That does not mean the species is absent there. The latest reports pulse:

  • Santiago, Chile
  • Magellan and the Chilean Antarctic, Chile
  • Tierra del Fuego, Argentina
  • Santa Cruz, Argentina

Where it is reported most often

For each country, the place where the species was reported on the most days. Tap a place.

This is no promise. It shows where people report it especially often.

Through the year

The species is most likely to be reported in November (17 % more often than the yearly average), least often in June (19 % less often). The bars show the difference from the yearly average, adjusted for the fact that more people are outdoors in summer. On the map, a cell is darker the more of its reports fall in the month shown.

January: about as often as the yearly average.

When is the species reported where?

Green means: in this month the species is reported there clearly more often than in the rest of the year. Blue means: clearly less often. We have adjusted for the fact that more people are outdoors in summer. Tap a square.

How often the species is reported per country and month, compared with the yearly average
CountryJFMAMJJASOND
All countriesreported about as often as the yearly averagereported about as often as the yearly averagereported about as often as the yearly averagereported about as often as the yearly averagereported 12 % less often than the yearly averagereported 19 % less often than the yearly averagereported about as often as the yearly averagereported about as often as the yearly averagereported about as often as the yearly averagereported 15 % more often than the yearly averagereported 17 % more often than the yearly averagereported about as often as the yearly average
Argentinareported about as often as the yearly averagereported about as often as the yearly averagereported about as often as the yearly averagereported about as often as the yearly averagereported about as often as the yearly averagereported 11 % less often than the yearly averagereported about as often as the yearly averagereported about as often as the yearly averagereported about as often as the yearly averagereported 14 % more often than the yearly averagereported about as often as the yearly averagereported about as often as the yearly average
Chilereported about as often as the yearly averagereported about as often as the yearly averagereported about as often as the yearly averagereported 10 % less often than the yearly averagereported 27 % less often than the yearly averagereported 31 % less often than the yearly averagereported 28 % less often than the yearly averagereported 11 % less often than the yearly averagereported about as often as the yearly averagereported 22 % more often than the yearly averagereported 31 % more often than the yearly averagereported 12 % more often than the yearly average
Ecuadorreported about as often as the yearly averageno clear difference from the yearly averagereported about as often as the yearly averageno clear difference from the yearly averagereported about as often as the yearly averagereported about as often as the yearly averagereported about as often as the yearly averagereported about as often as the yearly averagereported about as often as the yearly averagereported about as often as the yearly averageno clear difference from the yearly averageno clear difference from the yearly average
Perureported 28 % less often than the yearly averagereported 27 % less often than the yearly averagereported 22 % less often than the yearly averagereported about as often as the yearly averagereported 26 % more often than the yearly averageno clear difference from the yearly averagereported 21 % more often than the yearly averagereported 20 % more often than the yearly averagereported about as often as the yearly averagereported about as often as the yearly averagereported about as often as the yearly averagereported 25 % less often than the yearly average
Colombiareported 32 % more often than the yearly averageno clear difference from the yearly averageno clear difference from the yearly averageno clear difference from the yearly averageno clear difference from the yearly averageno clear difference from the yearly averageno clear difference from the yearly averagereported about as often as the yearly averagereported about as often as the yearly averageno clear difference from the yearly averagereported about as often as the yearly averageno clear difference from the yearly average
Boliviareported 33 % less often than the yearly averageno clear difference from the yearly averageno clear difference from the yearly averageno clear difference from the yearly averagereported about as often as the yearly averageno clear difference from the yearly averageno clear difference from the yearly averageno clear difference from the yearly averagereported 35 % more often than the yearly averageno clear difference from the yearly averageno clear difference from the yearly averageno clear difference from the yearly average
much less oftenless oftenno clear differencemore oftenmuch more often

In Argentina in October: reported 14 % more often than the yearly average. This is the strongest month there.

Who is reported in the same cells

In how many of 10 areas of this species the other species was reported as well. Counted are the 749 cells in which this species is reported regularly; compared with the other species that have a page.

Latest reports on the map

The map shows every cell with reports of this species, including the latest ones, and every other species as well.

View the Andean Condor on the map