Wildpulse Map
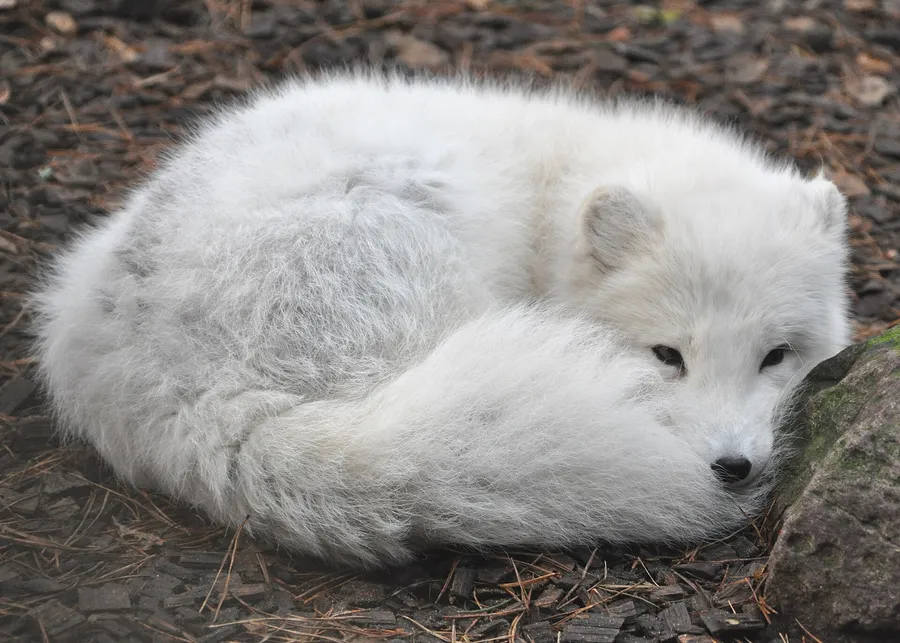
Photo: Arctic Fox

Arctic Fox

Vulpes lagopus

The Arctic fox is a small fox of the far north, with a short muzzle, small ears and a thick coat that is usually white in winter, though some animals turn bluish-grey instead. It lives in the tundra all around the North Pole and even roams out onto the pack ice. It eats almost anything, but its numbers rise and fall with the supply of lemmings, and it often trails polar bears to scavenge their leftovers. Experiments showed it can survive temperatures as low as minus 80 °C.

In our data the species was reported on 300 days in 7 countries, most often in Norway, Iceland and Greenland.

Last reported on September 18, 2026 in Greenland (Qaasuitsup)

View on the map

Photo: Quartl, CC BY-SA 3.0

Size and way of life

Size comparison: Arctic Fox, head-and-body length up to 62 cm, next to a person 1.75 m tall.50 cm1 m1.5 m up to 62 cm1.75 m
Body length, average for adults. The outline is scaled to this length and only approximate. The person next to it is 1.75 m tall.
Weight
up to 3.6 kglarge adults
Length
up to 62 cmbody length
Home range
14 km²average size of the area an animal lives in
Young
8 youngper litter, after a gestation of 52 days
Active
by daymainly diurnal
Altitude
up to 3,000 mabove sea level
Maximum age
16 yearsoldest recorded age

From birth to old age

  1. 70 gat birth
  2. 50 daysuntil the young are weaned
  3. 3.6 kgfully grown; able to breed at 10 months
  4. 16 yearsoldest recorded age

The area of each dot matches the weight.

Where the species lives and is reported

Drag to turn the globe
Country where it occurs

Where the species is at home

Tinted green are the 8 countries where the species occurs according to the scientific literature.

Country list: Mammal Diversity Database.

Where it was reported

Each hexagon is a cell about 40 km across in which people reported the species. The darker, the more days.

  • 300reporting days
  • 104cells
  • 7countries

Where it stays pale, few reports come in. That does not mean the species is absent there. The latest reports pulse:

  • Qaasuitsup, Greenland
  • Northeast Greenland National Park, Greenland
  • Svalbard, Norway
  • Nunavut, Canada

Where it is reported most often

For each country, the place where the species was reported on the most days. Tap a place.

This is no promise. It shows where people report it especially often.

Through the year

The species is most likely to be reported in January (488 % more often than the yearly average), least often in December. The bars show the difference from the yearly average, adjusted for the fact that more people are outdoors in summer. On the map, a cell is darker the more of its reports fall in the month shown.

January: 5.9 times as often as the yearly average.

When is the species reported where?

Green means: in this month the species is reported there clearly more often than in the rest of the year. Blue means: clearly less often. We have adjusted for the fact that more people are outdoors in summer. Tap a square.

How often the species is reported per country and month, compared with the yearly average
CountryJFMAMJJASOND
All countriesreported 5.9 times as often as the yearly averagereported 72 % less often than the yearly averagereported 81 % less often than the yearly averagereported 96 % less often than the yearly averagereported 67 % less often than the yearly averagereported about as often as the yearly averageno clear difference from the yearly averagereported about as often as the yearly averageno clear difference from the yearly averageno clear difference from the yearly averageno clear difference from the yearly averageno clear difference from the yearly average
Norwayreported 2.9 times as often as the yearly averageno clear difference from the yearly averageno clear difference from the yearly averageno clear difference from the yearly averageno clear difference from the yearly averagereported 2.4 times as often as the yearly averageno clear difference from the yearly averagereported about as often as the yearly averageno clear difference from the yearly averageno clear difference from the yearly averageno clear difference from the yearly averageno clear difference from the yearly average
Icelandreported 2.2 times as often as the yearly averageno clear difference from the yearly averageno clear difference from the yearly averageno clear difference from the yearly averageno clear difference from the yearly averageno clear difference from the yearly averageno clear difference from the yearly averagereported about as often as the yearly averageno clear difference from the yearly averageno clear difference from the yearly averageno clear difference from the yearly averageno clear difference from the yearly average
Greenlandreported 3.4 times as often as the yearly averageno clear difference from the yearly averageno clear difference from the yearly averageno clear difference from the yearly averageno clear difference from the yearly averageno clear difference from the yearly averageno clear difference from the yearly averageno clear difference from the yearly averageno clear difference from the yearly averageno clear difference from the yearly averageno clear difference from the yearly averageno clear difference from the yearly average
Russiareported 3.3 times as often as the yearly averageno clear difference from the yearly averageno clear difference from the yearly averageno clear difference from the yearly averageno clear difference from the yearly averageno clear difference from the yearly averagereported about as often as the yearly averageno clear difference from the yearly averageno clear difference from the yearly averageno clear difference from the yearly averageno clear difference from the yearly averageno clear difference from the yearly average
Swedenreported 10.2 times as often as the yearly averageno clear difference from the yearly averageno clear difference from the yearly averageno clear difference from the yearly averageno clear difference from the yearly averageno clear difference from the yearly averageno clear difference from the yearly averageno clear difference from the yearly averageno clear difference from the yearly averageno clear difference from the yearly averageno clear difference from the yearly averageno clear difference from the yearly average
much less oftenless oftenno clear differencemore oftenmuch more often

In Norway in January: reported 2.9 times as often as the yearly average. This is the strongest month there.

Who is reported in the same cells

In how many of 10 areas of this species the other species was reported as well. Counted are the 25 cells in which this species is reported regularly; compared with the other species that have a page.

Latest reports on the map

The map shows every cell with reports of this species, including the latest ones, and every other species as well.

View the Arctic Fox on the map