Wildpulse Map
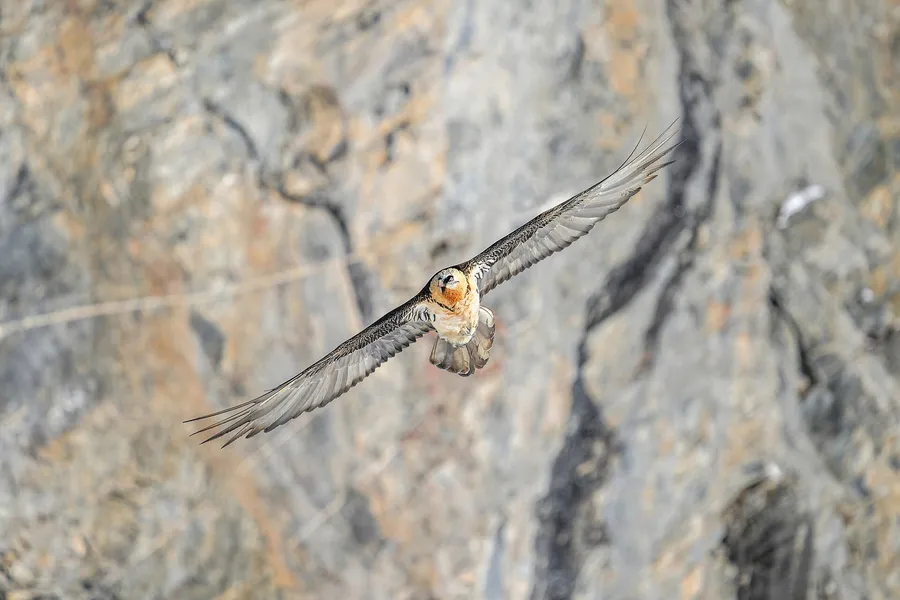
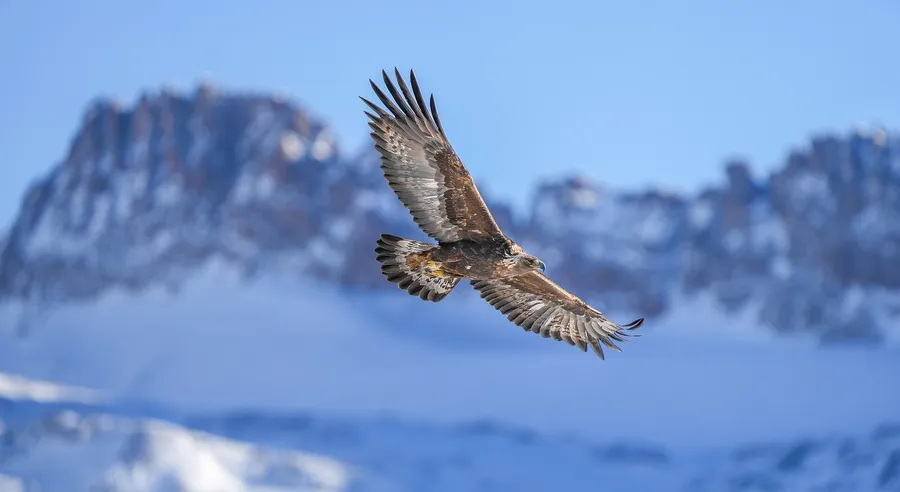
Photo: Bearded Vulture

Bearded Vulture

Gypaetus barbatus

The bearded vulture, or lammergeier, is a huge mountain vulture with a wingspan of up to nearly three metres, named for the bristly black feathers below its bill. It lives in mountain ranges of Europe, Africa and Asia, and was reintroduced to the Alps after being wiped out there. Bone makes up most of its diet, typically 70 to 90 percent. Bones too big to swallow are carried aloft and dropped onto rocks until they shatter, and its rusty colouring comes from bathing in iron-rich mud or dust.

In our data the species was reported on 34,121 days in 46 countries, most often in France, Spain and India.

Last reported on October 3, 2026 in Spain (León)

View on the map

Photo: Giles Laurent, CC BY-SA 4.0

Size and way of life

Wingspan
2.62 mfrom wingtip to wingtip

Where the species lives and is reported

Drag to turn the globe

Where it is reported

Most reports come from Europe (59 %), from Asia (34 %) and from Africa (7 %).

Counted are reporting days: days on which the species was reported at least once in a cell.

Where it was reported

Each hexagon is a cell about 40 km across in which people reported the species. The darker, the more days.

  • 34,121reporting days
  • 1,535cells
  • 46countries

Where it stays pale, few reports come in. That does not mean the species is absent there. The latest reports pulse:

  • León, Spain
  • Hautes-Pyrénées, France
  • Eastern Cape, South Africa
  • Tyrol, Austria

Where it is reported most often

For each country, the place where the species was reported on the most days. Tap a place.

This is no promise. It shows where people report it especially often.

Through the year

The species is most likely to be reported in July (21 % more often than the yearly average), least often in January (26 % less often). The bars show the difference from the yearly average, adjusted for the fact that more people are outdoors in summer. On the map, a cell is darker the more of its reports fall in the month shown.

January: 26 % less often than the yearly average.

When is the species reported where?

Green means: in this month the species is reported there clearly more often than in the rest of the year. Blue means: clearly less often. We have adjusted for the fact that more people are outdoors in summer. Tap a square.

How often the species is reported per country and month, compared with the yearly average
CountryJFMAMJJASOND
All countriesreported 26 % less often than the yearly averagereported about as often as the yearly averagereported 12 % less often than the yearly averagereported about as often as the yearly averagereported about as often as the yearly averagereported about as often as the yearly averagereported 21 % more often than the yearly averagereported 20 % more often than the yearly averagereported about as often as the yearly averagereported about as often as the yearly averagereported about as often as the yearly averagereported 21 % less often than the yearly average
Francereported 19 % less often than the yearly averagereported about as often as the yearly averagereported 16 % less often than the yearly averagereported 14 % less often than the yearly averagereported 20 % less often than the yearly averageno clear difference from the yearly averagereported 43 % more often than the yearly averagereported 57 % more often than the yearly averagereported 21 % more often than the yearly averagereported 13 % more often than the yearly averagereported 17 % less often than the yearly averagereported 29 % less often than the yearly average
Spainreported 18 % less often than the yearly averagereported about as often as the yearly averagereported about as often as the yearly averagereported 17 % more often than the yearly averagereported about as often as the yearly averageno clear difference from the yearly averagereported 16 % more often than the yearly averagereported 20 % more often than the yearly averagereported about as often as the yearly averagereported about as often as the yearly averagereported 14 % less often than the yearly averagereported 25 % less often than the yearly average
Indiareported 17 % less often than the yearly averagereported 40 % more often than the yearly averagereported 18 % more often than the yearly averagereported about as often as the yearly averagereported about as often as the yearly averagereported about as often as the yearly averagereported 25 % less often than the yearly averagereported 32 % less often than the yearly averageno clear difference from the yearly averagereported about as often as the yearly averagereported 19 % more often than the yearly averagereported about as often as the yearly average
People's Republic of Chinano clear difference from the yearly averagereported 45 % less often than the yearly averagereported 33 % less often than the yearly averageno clear difference from the yearly averageno clear difference from the yearly averagereported about as often as the yearly averagereported 31 % more often than the yearly averageno clear difference from the yearly averageno clear difference from the yearly averagereported about as often as the yearly averagereported about as often as the yearly averageno clear difference from the yearly average
South Africano clear difference from the yearly averageno clear difference from the yearly averagereported about as often as the yearly averagereported about as often as the yearly averagereported about as often as the yearly averagereported about as often as the yearly averagereported about as often as the yearly averagereported about as often as the yearly averageno clear difference from the yearly averagereported about as often as the yearly averagereported about as often as the yearly averagereported about as often as the yearly average
Italyreported about as often as the yearly averageno clear difference from the yearly averagereported about as often as the yearly averagereported 29 % less often than the yearly averagereported 39 % less often than the yearly averagereported about as often as the yearly averagereported 27 % more often than the yearly averageno clear difference from the yearly averageno clear difference from the yearly averageno clear difference from the yearly averageno clear difference from the yearly averageno clear difference from the yearly average
Mongoliano clear difference from the yearly averageno clear difference from the yearly averageno clear difference from the yearly averagereported 53 % less often than the yearly averagereported about as often as the yearly averagereported 25 % more often than the yearly averagereported about as often as the yearly averagereported about as often as the yearly averagereported about as often as the yearly averageno clear difference from the yearly averageno clear difference from the yearly averageno clear difference from the yearly average
Nepalreported 43 % less often than the yearly averagereported 71 % less often than the yearly averagereported about as often as the yearly averagereported 64 % more often than the yearly averageno clear difference from the yearly averagereported 62 % less often than the yearly averagereported 67 % less often than the yearly averagereported 55 % less often than the yearly averageno clear difference from the yearly averagereported 33 % more often than the yearly averagereported 69 % more often than the yearly averageno clear difference from the yearly average
much less oftenless oftenno clear differencemore oftenmuch more often

In France in August: reported 57 % more often than the yearly average. This is the strongest month there.

Who is reported in the same cells

In how many of 10 areas of this species the other species was reported as well. Counted are the 768 cells in which this species is reported regularly; compared with the other species that have a page.

Latest reports on the map

The map shows every cell with reports of this species, including the latest ones, and every other species as well.

View the Bearded Vulture on the map