Wildpulse Map
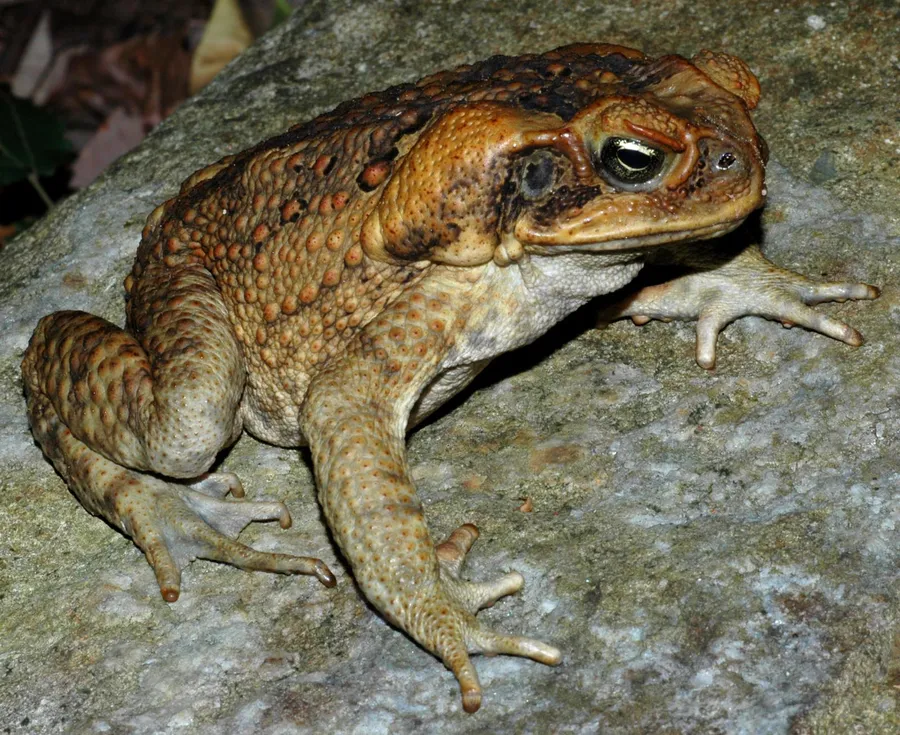
Photo: Cane Toad

Cane Toad

Rhinella marina

The cane toad is one of the world's largest toads, bulky, with prominent poison glands behind the eyes. It comes from Central and South America and eats almost anything it can overpower, from insects to other frogs and young mice. People released it in many places, Australia among them, to fight pests in sugar cane fields, and it became an invasive pest itself. Its toxic skin can kill animals that try to eat it, including dogs, and a female lays thousands of eggs at once.

In our data the species was reported on 10,426 days in 39 countries, most often in Australia, Brazil and the USA.

Last reported on November 19, 2026 in the USA (Hawaii)

View on the map

Photo: unknown, CC BY-SA 3.0

Where the species lives and is reported

Drag to turn the globe

Where it is reported

Most reports come from Oceania (71 %), from South America (18 %) and from North America (8 %).

Counted are reporting days: days on which the species was reported at least once in a cell.

Where it was reported

Each hexagon is a cell about 40 km across in which people reported the species. The darker, the more days.

  • 10,426reporting days
  • 991cells
  • 39countries

Where it stays pale, few reports come in. That does not mean the species is absent there. The latest reports pulse:

  • Hawaii, USA
  • Queensland, Australia
  • Couva-Tabaquite-Talparo, Trinidad and Tobago
  • Mato Grosso do Sul, Brazil

Where it is reported most often

For each country, the place where the species was reported on the most days. Tap a place.

This is no promise. It shows where people report it especially often.

Through the year

The species is most likely to be reported in June (58 % more often than the yearly average), least often in March (37 % less often). The bars show the difference from the yearly average, adjusted for the fact that more people are outdoors in summer. On the map, a cell is darker the more of its reports fall in the month shown.

January: 36 % less often than the yearly average.

When is the species reported where?

Green means: in this month the species is reported there clearly more often than in the rest of the year. Blue means: clearly less often. We have adjusted for the fact that more people are outdoors in summer. Tap a square.

How often the species is reported per country and month, compared with the yearly average
CountryJFMAMJJASOND
All countriesreported 36 % less often than the yearly averagereported 34 % less often than the yearly averagereported 37 % less often than the yearly averagereported about as often as the yearly averagereported 57 % more often than the yearly averagereported 58 % more often than the yearly averagereported 34 % more often than the yearly averagereported 39 % more often than the yearly averagereported 21 % more often than the yearly averagereported about as often as the yearly averagereported 21 % less often than the yearly averagereported 26 % less often than the yearly average
Australiareported 48 % less often than the yearly averagereported 43 % less often than the yearly averagereported 48 % less often than the yearly averagereported about as often as the yearly averagereported 76 % more often than the yearly averagereported 73 % more often than the yearly averagereported 55 % more often than the yearly averagereported 61 % more often than the yearly averagereported 25 % more often than the yearly averagereported about as often as the yearly averagereported 32 % less often than the yearly averagereported 32 % less often than the yearly average
Brazilno clear difference from the yearly averageno clear difference from the yearly averagereported about as often as the yearly averageno clear difference from the yearly averagereported about as often as the yearly averagereported about as often as the yearly averageno clear difference from the yearly averagereported about as often as the yearly averageno clear difference from the yearly averagereported about as often as the yearly averagereported about as often as the yearly averagereported about as often as the yearly average
USAno clear difference from the yearly averagereported about as often as the yearly averageno clear difference from the yearly averageno clear difference from the yearly averageno clear difference from the yearly averageno clear difference from the yearly averageno clear difference from the yearly averageno clear difference from the yearly averagereported about as often as the yearly averageno clear difference from the yearly averageno clear difference from the yearly averagereported about as often as the yearly average
Colombiano clear difference from the yearly averagereported 79 % less often than the yearly averageno clear difference from the yearly averageno clear difference from the yearly averagereported 76 % more often than the yearly averagereported 2.2 times as often as the yearly averagereported about as often as the yearly averageno clear difference from the yearly averagereported about as often as the yearly averageno clear difference from the yearly averagereported about as often as the yearly averageno clear difference from the yearly average
Francereported about as often as the yearly averageno clear difference from the yearly averageno clear difference from the yearly averageno clear difference from the yearly averageno clear difference from the yearly averageno clear difference from the yearly averageno clear difference from the yearly averagereported about as often as the yearly averagereported about as often as the yearly averageno clear difference from the yearly averageno clear difference from the yearly averageno clear difference from the yearly average
Peruno clear difference from the yearly averagereported about as often as the yearly averagereported about as often as the yearly averageno clear difference from the yearly averageno clear difference from the yearly averageno clear difference from the yearly averageno clear difference from the yearly averagereported about as often as the yearly averageno clear difference from the yearly averageno clear difference from the yearly averagereported 2.4 times as often as the yearly averageno clear difference from the yearly average
Mexicono clear difference from the yearly averageno clear difference from the yearly averagereported about as often as the yearly averageno clear difference from the yearly averageno clear difference from the yearly averageno clear difference from the yearly averagereported about as often as the yearly averagereported about as often as the yearly averagereported about as often as the yearly averagereported about as often as the yearly averageno clear difference from the yearly averageno clear difference from the yearly average
Philippinesreported about as often as the yearly averageno clear difference from the yearly averagereported about as often as the yearly averageno clear difference from the yearly averagereported about as often as the yearly averageno clear difference from the yearly averageno clear difference from the yearly averageno clear difference from the yearly averageno clear difference from the yearly averageno clear difference from the yearly averageno clear difference from the yearly averageno clear difference from the yearly average
much less oftenless oftenno clear differencemore oftenmuch more often

In Australia in May: reported 76 % more often than the yearly average. This is the strongest month there.

Latest reports on the map

The map shows every cell with reports of this species, including the latest ones, and every other species as well.

View the Cane Toad on the map