Wildpulse Map
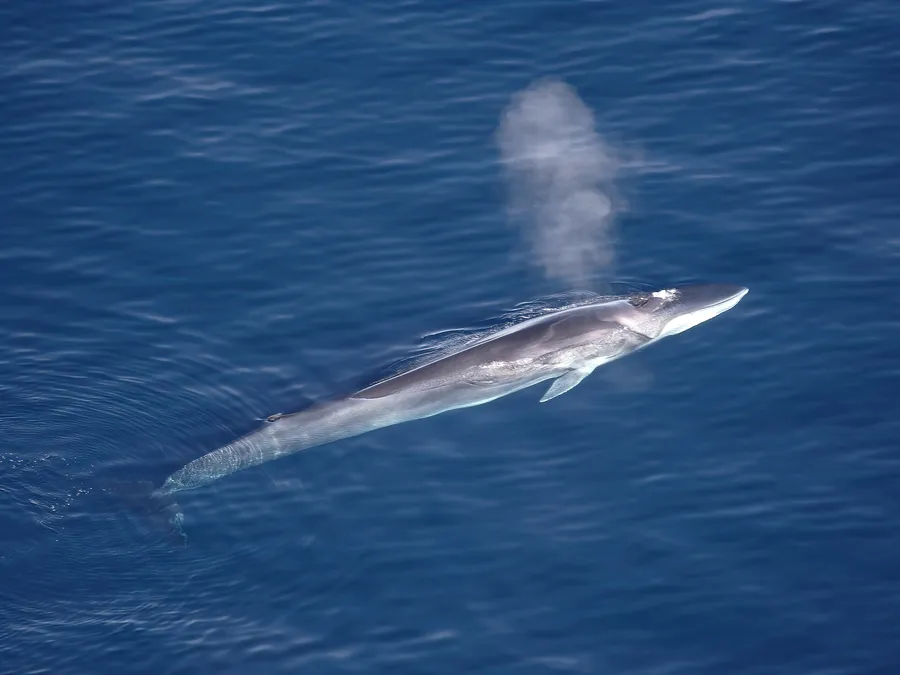
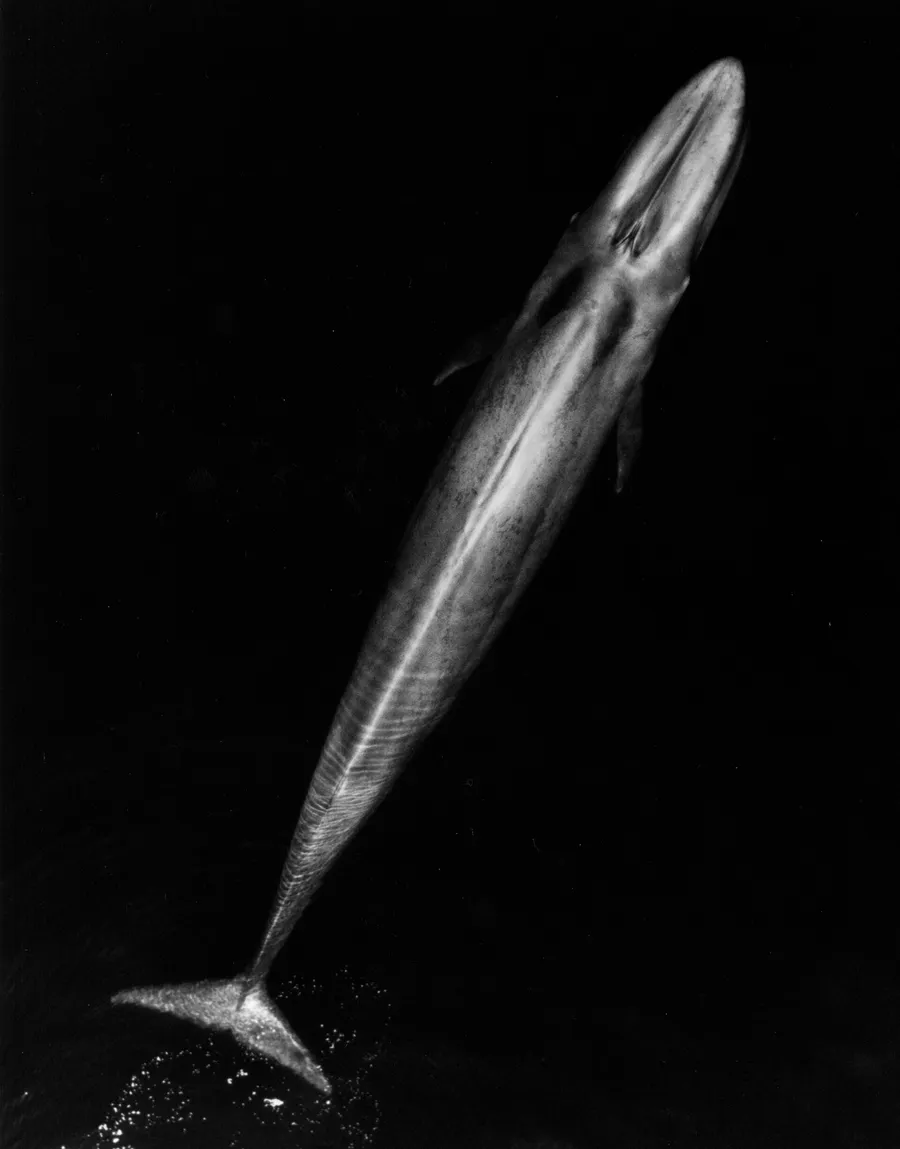
Photo: Fin Whale

Fin Whale

Balaenoptera physalus

The fin whale is the second-longest whale after the blue whale, with adults mostly measuring about 18 to 27 metres depending on the region. A tell-tale sign is its lopsided colouring: the right lower jaw is white, the left one dark. It ranges through every large ocean, from icy polar seas to the tropics, and as a baleen whale it filters krill, small schooling fish and squid from the sea. One of the fastest large whales, it was heavily hunted during the whaling era.

In our data the species was reported on 6,564 days in 26 countries, most often in Canada, the USA and France.

Last reported on October 24, 2026 in Norway (Finnmark)

View on the map

Photo: Aqqa Rosing-Asvid - Visit Greenland, CC BY 2.0

Size and way of life

Size comparison: Fin Whale, head-and-body length up to 17.92 m, next to a person 1.75 m tall.1 m2 m3 m up to 17.92 m1.75 m
Body length, average for adults. The outline is scaled to this length and only approximate. The person next to it is 1.75 m tall.
Weight
up to 38.8 tlarge adults
Length
up to 17.92 mbody length
Young
1 youngper litter, after a gestation of 11 months
Active
by daymainly diurnal
Maximum age
116 yearsoldest recorded age

From birth to old age

  1. 1.6 tat birth
  2. 6.4 tat 7 months, when the young are weaned
  3. 38.8 tfully grown; able to breed at 7 years
  4. 116 yearsoldest recorded age

The area of each dot matches the weight.

Where the species lives and is reported

Drag to turn the globe
Country where it occurs

Where the species is at home

Tinted green are the 59 countries where the species occurs according to the scientific literature, paler the uncertain ones.

Country list: Mammal Diversity Database.

Where it was reported

Each hexagon is a cell about 40 km across in which people reported the species. The darker, the more days.

  • 6,564reporting days
  • 1,474cells
  • 26countries

Where it stays pale, few reports come in. That does not mean the species is absent there. The latest reports pulse:

  • Finnmark, Norway
  • Friesland, Netherlands
  • California, USA
  • Alaska, USA

Where it is reported most often

For each country, the place where the species was reported on the most days. Tap a place.

This is no promise. It shows where people report it especially often.

Through the year

The species is most likely to be reported in August (93 % more often than the yearly average), least often in December (67 % less often). The bars show the difference from the yearly average, adjusted for the fact that more people are outdoors in summer. On the map, a cell is darker the more of its reports fall in the month shown.

January: 91 % more often than the yearly average.

When is the species reported where?

Green means: in this month the species is reported there clearly more often than in the rest of the year. Blue means: clearly less often. We have adjusted for the fact that more people are outdoors in summer. Tap a square.

How often the species is reported per country and month, compared with the yearly average
CountryJFMAMJJASOND
All countriesreported 91 % more often than the yearly averagereported 43 % less often than the yearly averagereported 39 % less often than the yearly averagereported 62 % less often than the yearly averagereported 41 % less often than the yearly averagereported 12 % less often than the yearly averagereported 66 % more often than the yearly averagereported 93 % more often than the yearly averagereported 24 % more often than the yearly averagereported 39 % less often than the yearly averagereported 50 % less often than the yearly averagereported 67 % less often than the yearly average
Canadareported 96 % less often than the yearly averageno reportsreported 90 % less often than the yearly averagereported 61 % less often than the yearly averagereported 58 % less often than the yearly averagereported 29 % less often than the yearly averagereported 17 % more often than the yearly averagereported 48 % more often than the yearly averageno clear difference from the yearly averagereported about as often as the yearly averagereported 52 % less often than the yearly averagereported 77 % less often than the yearly average
USAno clear difference from the yearly averagereported about as often as the yearly averageno clear difference from the yearly averagereported 37 % less often than the yearly averagereported 40 % less often than the yearly averageno clear difference from the yearly averagereported 48 % more often than the yearly averagereported 76 % more often than the yearly averagereported 44 % more often than the yearly averageno clear difference from the yearly averagereported 56 % less often than the yearly averagereported 48 % less often than the yearly average
Francereported 4.1 times as often as the yearly averagereported 79 % less often than the yearly averagereported 74 % less often than the yearly averagereported 87 % less often than the yearly averagereported 62 % less often than the yearly averagereported 53 % less often than the yearly averagereported 2 times as often as the yearly averagereported 2.2 times as often as the yearly averagereported 46 % less often than the yearly averagereported 52 % less often than the yearly averagereported 66 % less often than the yearly averagereported 69 % less often than the yearly average
Mexicono clear difference from the yearly averagereported about as often as the yearly averagereported 59 % more often than the yearly averageno clear difference from the yearly averageno clear difference from the yearly averageno clear difference from the yearly averageno clear difference from the yearly averageno clear difference from the yearly averageno clear difference from the yearly averageno clear difference from the yearly averageno clear difference from the yearly averageno clear difference from the yearly average
Norwayreported about as often as the yearly averageno clear difference from the yearly averageno clear difference from the yearly averagereported about as often as the yearly averageno clear difference from the yearly averageno clear difference from the yearly averageno clear difference from the yearly averageno clear difference from the yearly averageno clear difference from the yearly averageno clear difference from the yearly averageno clear difference from the yearly averageno clear difference from the yearly average
Portugalreported 5.7 times as often as the yearly averageno clear difference from the yearly averageno clear difference from the yearly averageno clear difference from the yearly averageno clear difference from the yearly averagereported 86 % less often than the yearly averagereported 88 % less often than the yearly averagereported 91 % less often than the yearly averagereported 92 % less often than the yearly averageno clear difference from the yearly averageno clear difference from the yearly averageno clear difference from the yearly average
Saint Pierre and Miquelonno clear difference from the yearly averageno clear difference from the yearly averageno clear difference from the yearly averageno clear difference from the yearly averageno clear difference from the yearly averageno clear difference from the yearly averageno clear difference from the yearly averagereported 74 % more often than the yearly averagereported 2 times as often as the yearly averageno clear difference from the yearly averageno clear difference from the yearly averageno clear difference from the yearly average
Spainno clear difference from the yearly averageno clear difference from the yearly averageno clear difference from the yearly averageno clear difference from the yearly averageno clear difference from the yearly averageno clear difference from the yearly averageno clear difference from the yearly averagereported 2.4 times as often as the yearly averageno clear difference from the yearly averageno clear difference from the yearly averageno clear difference from the yearly averageno clear difference from the yearly average
much less oftenless oftenno clear differencemore oftenmuch more often

In Canada in August: reported 48 % more often than the yearly average. This is the strongest month there.

Who is reported in the same cells

In how many of 10 areas of this species the other species was reported as well. Counted are the 457 cells in which this species is reported regularly; compared with the other species that have a page.

Latest reports on the map

The map shows every cell with reports of this species, including the latest ones, and every other species as well.

View the Fin Whale on the map