Wildpulse Map
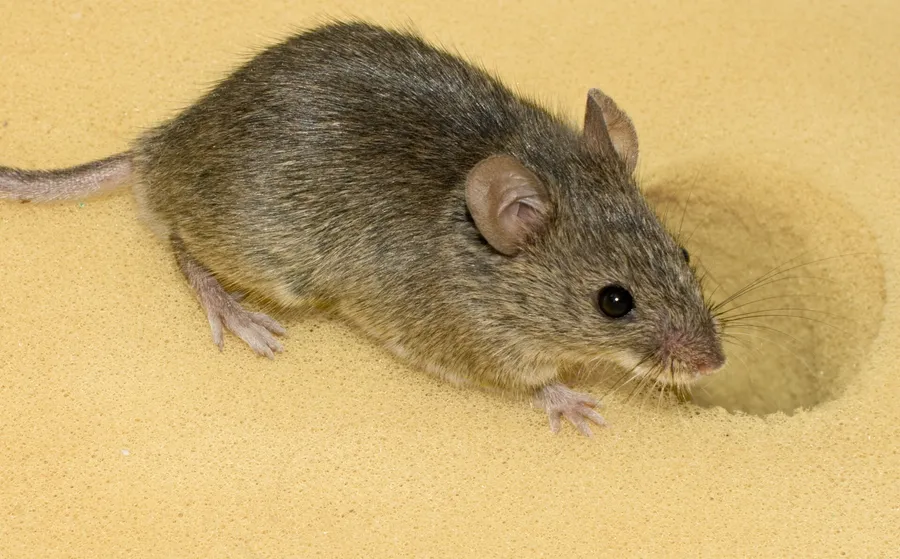
Photo: House Mouse

House Mouse

Mus musculus

The house mouse is a small grey-brown rodent with big round ears and a long tail that is almost bare of hair. It originated in the region of present-day India and Iran and has followed people across nearly the whole world, living in houses, barns and fields. Its diet is mostly seeds and other plant food, topped up with insects. It is a notorious pest of stored food, yet its domesticated form, the lab mouse, is one of the most important animals in medical research.

In our data the species was reported on 20,960 days in 55 countries, most often in Australia, France and Germany.

Last reported on November 19, 2026 in Russia (Moscow)

View on the map

Photo: George Shuklin (talk), CC BY-SA 1.0

Size and way of life

Weight
20 gaverage for adults
Length
9.5 cmhead and body, without tail
Home range
0.001 km²average size of the area an animal lives in
Young
6 youngper litter, after a gestation of 20 days
Active
at nightmainly nocturnal
Maximum age
6 yearsoldest recorded age

From birth to old age

  1. 1.2 gat birth
  2. 8.9 gat 22 days, when the young are weaned
  3. 20 gfully grown; able to breed at 2 months
  4. 6 yearsoldest recorded age

The area of each dot matches the weight.

Where the species lives and is reported

Drag to turn the globe
Country where it occurs

Where the species is at home

Tinted green are the 89 countries where the species occurs according to the scientific literature.

Country list: Mammal Diversity Database.

Where it was reported

Each hexagon is a cell about 40 km across in which people reported the species. The darker, the more days.

  • 20,960reporting days
  • 1,656cells
  • 55countries

Where it stays pale, few reports come in. That does not mean the species is absent there. The latest reports pulse:

  • Moscow, Russia
  • Texas, USA
  • Croydon, United Kingdom
  • Novosibirsk, Russia

Where it is reported most often

For each country, the place where the species was reported on the most days. Tap a place.

This is no promise. It shows where people report it especially often.

Through the year

The species is most likely to be reported in November (47 % more often than the yearly average), least often in August (37 % less often). The bars show the difference from the yearly average, adjusted for the fact that more people are outdoors in summer. On the map, a cell is darker the more of its reports fall in the month shown.

January: 19 % more often than the yearly average.

When is the species reported where?

Green means: in this month the species is reported there clearly more often than in the rest of the year. Blue means: clearly less often. We have adjusted for the fact that more people are outdoors in summer. Tap a square.

How often the species is reported per country and month, compared with the yearly average
CountryJFMAMJJASOND
All countriesreported 19 % more often than the yearly averagereported about as often as the yearly averagereported 14 % more often than the yearly averagereported 21 % more often than the yearly averagereported 11 % less often than the yearly averagereported 33 % less often than the yearly averagereported 33 % less often than the yearly averagereported 37 % less often than the yearly averagereported about as often as the yearly averagereported 28 % more often than the yearly averagereported 47 % more often than the yearly averagereported 20 % more often than the yearly average
Australiareported 20 % less often than the yearly averagereported about as often as the yearly averagereported 25 % more often than the yearly averagereported 43 % more often than the yearly averagereported about as often as the yearly averagereported 13 % less often than the yearly averagereported 21 % less often than the yearly averagereported 39 % less often than the yearly averagereported 18 % less often than the yearly averagereported about as often as the yearly averagereported 15 % more often than the yearly averagereported about as often as the yearly average
Francereported 2.4 times as often as the yearly averagereported about as often as the yearly averagereported about as often as the yearly averagereported 18 % less often than the yearly averagereported 38 % less often than the yearly averagereported 41 % less often than the yearly averagereported 21 % less often than the yearly averagereported 29 % less often than the yearly averagereported about as often as the yearly averageno clear difference from the yearly averagereported 40 % more often than the yearly averageno clear difference from the yearly average
Germanyno clear difference from the yearly averageno clear difference from the yearly averagereported about as often as the yearly averagereported about as often as the yearly averageno clear difference from the yearly averagereported about as often as the yearly averagereported about as often as the yearly averageno clear difference from the yearly averageno clear difference from the yearly averageno clear difference from the yearly averageno clear difference from the yearly averagereported 45 % more often than the yearly average
Switzerlandno clear difference from the yearly averageno clear difference from the yearly averagereported about as often as the yearly averageno clear difference from the yearly averagereported about as often as the yearly averagereported 37 % less often than the yearly averagereported 37 % less often than the yearly averagereported about as often as the yearly averagereported 61 % more often than the yearly averagereported 50 % more often than the yearly averageno clear difference from the yearly averagereported 50 % less often than the yearly average
Swedenreported 79 % more often than the yearly averageno clear difference from the yearly averageno clear difference from the yearly averageno clear difference from the yearly averagereported 38 % less often than the yearly averagereported 57 % less often than the yearly averagereported 46 % less often than the yearly averagereported 59 % less often than the yearly averagereported about as often as the yearly averagereported 48 % more often than the yearly averagereported 2.5 times as often as the yearly averagereported 2.2 times as often as the yearly average
United Kingdomno clear difference from the yearly averageno clear difference from the yearly averagereported about as often as the yearly averagereported about as often as the yearly averagereported about as often as the yearly averagereported 39 % less often than the yearly averagereported 47 % less often than the yearly averageno clear difference from the yearly averageno clear difference from the yearly averagereported 77 % more often than the yearly averageno clear difference from the yearly averageno clear difference from the yearly average
Denmarkreported 3 times as often as the yearly averagereported 59 % less often than the yearly averagereported 56 % less often than the yearly averagereported 56 % less often than the yearly averagereported 71 % less often than the yearly averagereported 73 % less often than the yearly averagereported 70 % less often than the yearly averagereported 60 % less often than the yearly averagereported 2.3 times as often as the yearly averagereported 2.3 times as often as the yearly averagereported 89 % more often than the yearly averagereported about as often as the yearly average
Norwayreported 84 % more often than the yearly averagereported about as often as the yearly averageno clear difference from the yearly averageno clear difference from the yearly averagereported 51 % less often than the yearly averageno clear difference from the yearly averagereported 55 % less often than the yearly averageno clear difference from the yearly averageno clear difference from the yearly averagereported 73 % more often than the yearly averagereported 2.8 times as often as the yearly averagereported 67 % more often than the yearly average
much less oftenless oftenno clear differencemore oftenmuch more often

In Australia in April: reported 43 % more often than the yearly average. This is the strongest month there.

Who is reported in the same cells

In how many of 10 areas of this species the other species was reported as well. Counted are the 1,084 cells in which this species is reported regularly; compared with the other species that have a page.

Latest reports on the map

The map shows every cell with reports of this species, including the latest ones, and every other species as well.

View the House Mouse on the map