Wildpulse Map
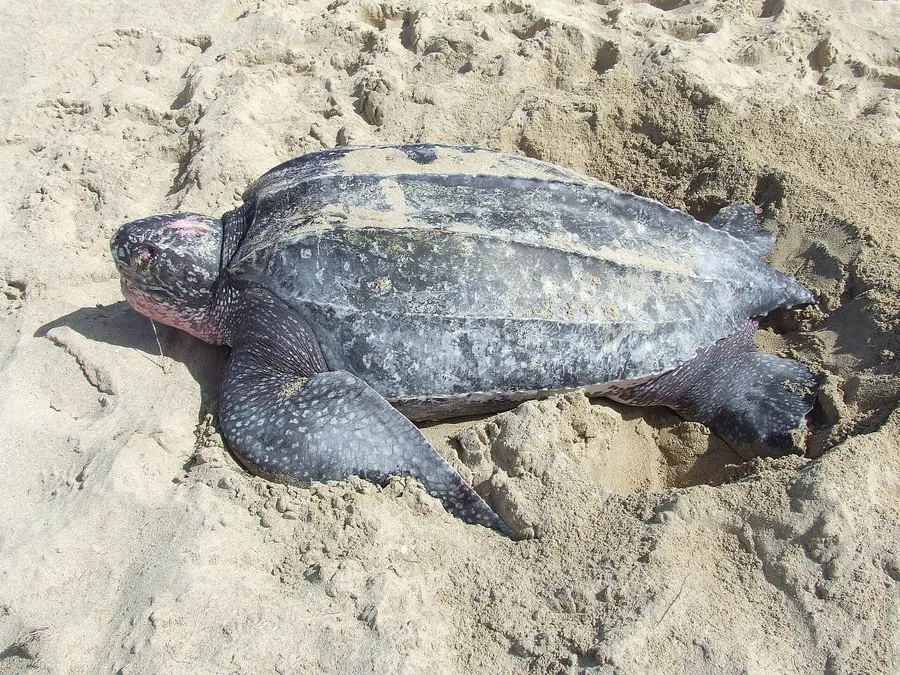
Photo: Leatherback Sea Turtle

Leatherback Sea Turtle

Dermochelys coriacea

The leatherback is the largest living turtle, reaching more than two metres in length and several hundred kilograms in weight. Instead of a hard shell of horny plates it has a back covered in leathery skin with seven ridges running along it. It roams all the world's oceans, including cold waters, and dives more than a kilometre deep. It lives almost entirely on jellyfish, so floating plastic bags, which it can mistake for prey, are a serious threat.

In our data the species was reported on 3,128 days in 46 countries, most often in France, the USA and Brazil. Reports shift with the seasons: in August, 45 % of reports come from Europe, in March 4 %.

Last reported on August 6, 2026 in Ireland (Cork)

View on the map

Photo: U.S. Fish and Wildlife Service Southeast Region, Public domain

Where the species lives and is reported

Drag to turn the globe

Where it is reported

Most reports come from Europe (44 %), from North America (23 %) and from Africa (15 %).

Counted are reporting days: days on which the species was reported at least once in a cell.

Where it was reported

Each hexagon is a cell about 40 km across in which people reported the species. The darker, the more days.

  • 3,128reporting days
  • 943cells
  • 46countries

Where it stays pale, few reports come in. That does not mean the species is absent there. The latest reports pulse:

  • Cork, Ireland
  • Nova Scotia, Canada
  • Rocha, Uruguay
  • Buenos Aires, Argentina

Where it is reported most often

For each country, the place where the species was reported on the most days. Tap a place.

This is no promise. It shows where people report it especially often.

Through the year

The species is most likely to be reported in January (75 % more often than the yearly average), least often in April (55 % less often). The bars show the difference from the yearly average, adjusted for the fact that more people are outdoors in summer. On the map, a cell is darker the more of its reports fall in the month shown.

January: 75 % more often than the yearly average, 44 % of reporting days from Europe.

When is the species reported where?

Green means: in this month the species is reported there clearly more often than in the rest of the year. Blue means: clearly less often. We have adjusted for the fact that more people are outdoors in summer. Tap a square.

How often the species is reported per country and month, compared with the yearly average
CountryJFMAMJJASOND
All countriesreported 75 % more often than the yearly averageno clear difference from the yearly averagereported 49 % less often than the yearly averagereported 55 % less often than the yearly averagereported 43 % less often than the yearly averagereported 27 % less often than the yearly averagereported 47 % more often than the yearly averagereported 70 % more often than the yearly averagereported about as often as the yearly averageno clear difference from the yearly averageno clear difference from the yearly averagereported 33 % more often than the yearly average
Francereported 8 times as often as the yearly averageno clear difference from the yearly averagereported 94 % less often than the yearly averagereported 90 % less often than the yearly averagereported 80 % less often than the yearly averagereported 73 % less often than the yearly averageno clear difference from the yearly averagereported 92 % more often than the yearly averageno clear difference from the yearly averagereported 78 % more often than the yearly averagereported 2 times as often as the yearly averagereported 2.6 times as often as the yearly average
USAno clear difference from the yearly averageno clear difference from the yearly averagereported 66 % less often than the yearly averagereported 60 % less often than the yearly averageno clear difference from the yearly averageno clear difference from the yearly averageno clear difference from the yearly averageno clear difference from the yearly averageno clear difference from the yearly averageno clear difference from the yearly averageno clear difference from the yearly averageno clear difference from the yearly average
Brazilreported about as often as the yearly averageno clear difference from the yearly averageno clear difference from the yearly averageno clear difference from the yearly averageno clear difference from the yearly averageno clear difference from the yearly averageno clear difference from the yearly averageno clear difference from the yearly averageno clear difference from the yearly averagereported about as often as the yearly averagereported 72 % more often than the yearly averagereported 70 % more often than the yearly average
Irelandno clear difference from the yearly averageno clear difference from the yearly averagereported 92 % less often than the yearly averageno reportsreported 86 % less often than the yearly averageno clear difference from the yearly averageno clear difference from the yearly averagereported 69 % more often than the yearly averageno clear difference from the yearly averagereported 2.8 times as often as the yearly averagereported 3.3 times as often as the yearly averageno clear difference from the yearly average
Cameroonreported 66 % more often than the yearly averageno clear difference from the yearly averageno clear difference from the yearly averageno clear difference from the yearly averageno clear difference from the yearly averageno clear difference from the yearly averageno clear difference from the yearly averageno clear difference from the yearly averageno clear difference from the yearly averageno clear difference from the yearly averagereported about as often as the yearly averagereported 76 % more often than the yearly average
Australiano clear difference from the yearly averageno clear difference from the yearly averageno clear difference from the yearly averagereported 3.1 times as often as the yearly averagereported about as often as the yearly averageno clear difference from the yearly averageno clear difference from the yearly averageno clear difference from the yearly averageno clear difference from the yearly averagereported about as often as the yearly averageno clear difference from the yearly averagereported about as often as the yearly average
United Kingdomreported 14.7 times as often as the yearly averageno clear difference from the yearly averageno clear difference from the yearly averageno clear difference from the yearly averageno clear difference from the yearly averageno clear difference from the yearly averagereported about as often as the yearly averageno clear difference from the yearly averageno clear difference from the yearly averageno clear difference from the yearly averageno clear difference from the yearly averagereported 17.2 times as often as the yearly average
Beninno clear difference from the yearly averagereported 15 times as often as the yearly averageno clear difference from the yearly averageno clear difference from the yearly averageno clear difference from the yearly averagereported about as often as the yearly averageno clear difference from the yearly averageno clear difference from the yearly averageno clear difference from the yearly averageno clear difference from the yearly averageno clear difference from the yearly averageno clear difference from the yearly average
much less oftenless oftenno clear differencemore oftenmuch more often

In France in January: reported 8 times as often as the yearly average. This is the strongest month there.

Who is reported in the same cells

In how many of 10 areas of this species the other species was reported as well. Counted are the 287 cells in which this species is reported regularly; compared with the other species that have a page.

Latest reports on the map

The map shows every cell with reports of this species, including the latest ones, and every other species as well.

View the Leatherback Sea Turtle on the map