Wildpulse Map
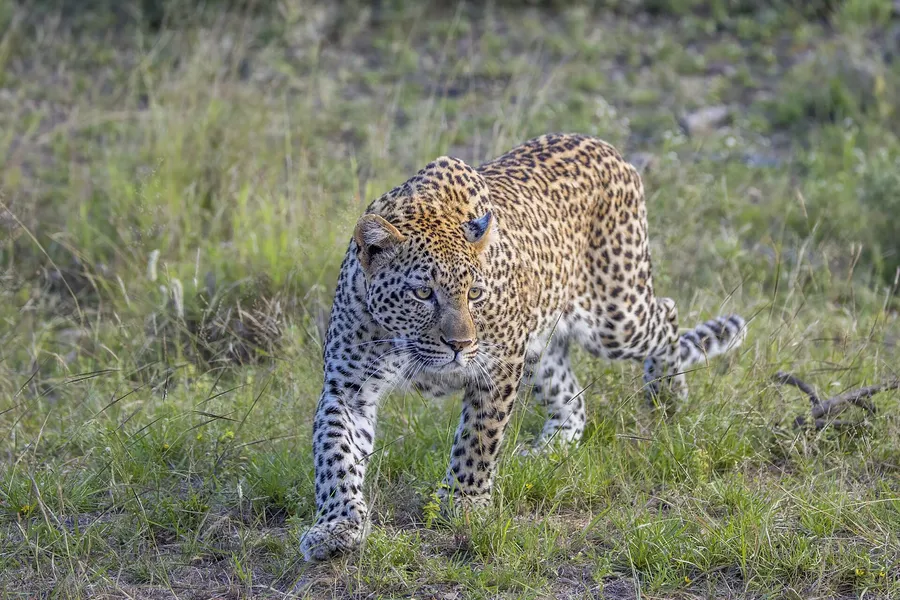
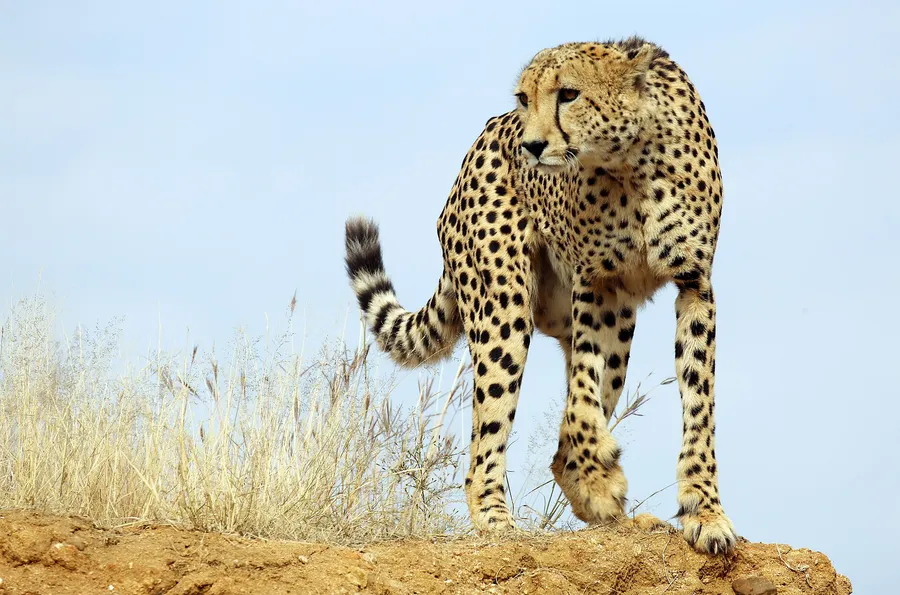
Photo: Leopard

Leopard

Panthera pardus

The leopard is a powerful big cat with pale yellow to golden fur covered in dark rosettes, and black individuals are known as black panthers. It has the widest range of any big cat, across Africa and Asia, and copes with habitats from rainforest and mountains to semi-desert. A solitary ambush hunter, it takes mainly medium-sized hoofed mammals and monkeys, but also birds and reptiles. It sometimes drags heavy kills up into a tree.

In our data the species was reported on 618 days in 18 countries, most often in India, Tanzania and Kenya.

Last reported on November 17, 2026 in India (Himachal Pradesh)

View on the map

Photo: Charles J. Sharp, CC BY-SA 4.0

Size and way of life

Size comparison: Leopard, head-and-body length 1.64 m, next to a person 1.75 m tall.50 cm1 m1.5 m 1.64 m1.75 m
Head and body, average for adults. The outline is scaled to this length and only approximate. The person next to it is 1.75 m tall.
Weight
53 kgaverage for adults
Length
1.64 mhead and body, without tail
Home range
19 km²average size of the area an animal lives in
Young
2 youngper litter, after a gestation of 3 months
Active
at nightmainly nocturnal
Altitude
up to 5,200 mabove sea level
Maximum age
27 yearsoldest recorded age

From birth to old age

  1. 550 gat birth
  2. 1.9 kgat 4 months, when the young are weaned
  3. 53 kgfully grown; able to breed at 2 years
  4. 27 yearsoldest recorded age

The area of each dot matches the weight.

How big a home range is

On average 19 km². The circle shows this area at the same scale as the city. Choose a city or tap the picture to move the circle.

Toronto is as big as 35 home ranges.

Toronto: 662 km². Home range: 19 km², as a circle 4.9 km across. One square in the grid is 10 km wide.

The species does not necessarily live in these cities; the comparison only shows the size. 19 km² is an average from the scientific literature (COMBINE). Real home ranges are not round and can be much smaller or larger depending on the region.

Outline of Toronto (662 km²) with a circle of 19 km², the average home range, at the same scale. 19 km²

Where the species lives and is reported

Drag to turn the globe
Country where it occurs

Where the species is at home

Tinted green are the 63 countries where the species occurs according to the scientific literature, paler the uncertain ones.

Country list: Mammal Diversity Database.

Where it was reported

Each hexagon is a cell about 40 km across in which people reported the species. The darker, the more days.

  • 618reporting days
  • 201cells
  • 18countries

Where it stays pale, few reports come in. That does not mean the species is absent there. The latest reports pulse:

  • Himachal Pradesh, India
  • Ratnapura, Sri Lanka
  • Mpumalanga, South Africa
  • Hambantota, Sri Lanka

Where it is reported most often

For each country, the place where the species was reported on the most days. Tap a place.

This is no promise. It shows where people report it especially often.

Through the year

The species is most likely to be reported in December, least often in June (49 % less often). The bars show the difference from the yearly average, adjusted for the fact that more people are outdoors in summer. On the map, a cell is darker the more of its reports fall in the month shown.

January: 15 % more often than the yearly average.

When is the species reported where?

Green means: in this month the species is reported there clearly more often than in the rest of the year. Blue means: clearly less often. We have adjusted for the fact that more people are outdoors in summer. Tap a square.

How often the species is reported per country and month, compared with the yearly average
CountryJFMAMJJASOND
All countriesno clear difference from the yearly averageno clear difference from the yearly averagereported about as often as the yearly averageno clear difference from the yearly averagereported about as often as the yearly averagereported 49 % less often than the yearly averageno clear difference from the yearly averageno clear difference from the yearly averageno clear difference from the yearly averageno clear difference from the yearly averageno clear difference from the yearly averageno clear difference from the yearly average
Indiano clear difference from the yearly averageno clear difference from the yearly averagereported about as often as the yearly averageno clear difference from the yearly averageno clear difference from the yearly averageno clear difference from the yearly averageno clear difference from the yearly averageno clear difference from the yearly averagereported about as often as the yearly averageno clear difference from the yearly averageno clear difference from the yearly averageno clear difference from the yearly average
Tanzaniano clear difference from the yearly averageno clear difference from the yearly averageno clear difference from the yearly averageno clear difference from the yearly averageno clear difference from the yearly averageno clear difference from the yearly averageno clear difference from the yearly averageno clear difference from the yearly averagereported 3.4 times as often as the yearly averageno clear difference from the yearly averageno clear difference from the yearly averageno clear difference from the yearly average
Kenyano clear difference from the yearly averagereported about as often as the yearly averageno clear difference from the yearly averageno clear difference from the yearly averageno clear difference from the yearly averageno clear difference from the yearly averagereported about as often as the yearly averageno clear difference from the yearly averageno clear difference from the yearly averageno clear difference from the yearly averageno clear difference from the yearly averageno clear difference from the yearly average
South Africano clear difference from the yearly averagereported about as often as the yearly averageno clear difference from the yearly averageno clear difference from the yearly averageno clear difference from the yearly averageno clear difference from the yearly averageno clear difference from the yearly averageno clear difference from the yearly averageno clear difference from the yearly averageno clear difference from the yearly averagereported about as often as the yearly averageno clear difference from the yearly average
much less oftenless oftenno clear differencemore oftenmuch more often

In India in November: no clear difference from the yearly average. There are too few reports there to tell.

Who is reported in the same cells

In how many of 10 areas of this species the other species was reported as well. Counted are the 39 cells in which this species is reported regularly; compared with the other species that have a page.

Latest reports on the map

The map shows every cell with reports of this species, including the latest ones, and every other species as well.

View the Leopard on the map