Wildpulse Map
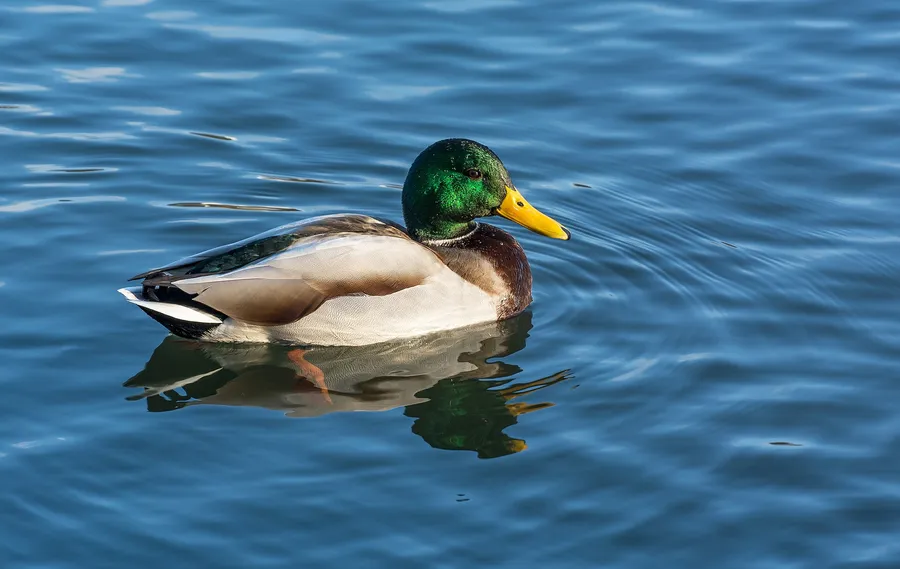
Photo: Mallard

Mallard

Anas platyrhynchos

The mallard is the largest and most common dabbling duck in Europe and the wild ancestor of most domestic ducks. Breeding drakes have a glossy green head, a white neck ring and a yellow bill, while females are mottled brown; both show a blue-purple wing patch. Mallards live across Eurasia, North America and the far north of Africa on almost any kind of water, including in towns. They eat mostly plants and seeds plus small animals, tipping head-down to feed below the surface.

In our data the species was reported on 6,742,684 days in 152 countries, most often in the USA, Canada and Sweden.

Last reported on November 22, 2026 in the USA (Pennsylvania)

View on the map

Photo: Jacek Halicki, CC BY-SA 4.0

Size and way of life

Wingspan
88 cmfrom wingtip to wingtip

Where the species lives and is reported

Drag to turn the globe

Where it is reported

Most reports come from North America (58 %) and from Europe (38 %).

Counted are reporting days: days on which the species was reported at least once in a cell.

Where it was reported

Each hexagon is a cell about 40 km across in which people reported the species. The darker, the more days.

  • 6,742,684reporting days
  • 18,705cells
  • 152countries

Where it stays pale, few reports come in. That does not mean the species is absent there. The latest reports pulse:

  • Pennsylvania, USA
  • Kyiv, Ukraine
  • Essex, United Kingdom
  • Warwickshire, United Kingdom

Where it is reported most often

For each country, the place where the species was reported on the most days. Tap a place.

This is no promise. It shows where people report it especially often.

Through the year

The species is most likely to be reported in April (23 % more often than the yearly average), least often in July (22 % less often). The bars show the difference from the yearly average, adjusted for the fact that more people are outdoors in summer. On the map, a cell is darker the more of its reports fall in the month shown.

January: about as often as the yearly average.

When is the species reported where?

Green means: in this month the species is reported there clearly more often than in the rest of the year. Blue means: clearly less often. We have adjusted for the fact that more people are outdoors in summer. Tap a square.

How often the species is reported per country and month, compared with the yearly average
CountryJFMAMJJASOND
All countriesreported about as often as the yearly averagereported about as often as the yearly averagereported 11 % more often than the yearly averagereported 23 % more often than the yearly averagereported 16 % more often than the yearly averagereported 13 % less often than the yearly averagereported 22 % less often than the yearly averagereported 11 % less often than the yearly averagereported about as often as the yearly averagereported about as often as the yearly averagereported about as often as the yearly averagereported about as often as the yearly average
USAreported about as often as the yearly averagereported about as often as the yearly averagereported 16 % more often than the yearly averagereported 20 % more often than the yearly averagereported 12 % more often than the yearly averagereported 15 % less often than the yearly averagereported 24 % less often than the yearly averagereported 14 % less often than the yearly averagereported 11 % less often than the yearly averagereported about as often as the yearly averagereported about as often as the yearly averagereported about as often as the yearly average
Canadareported 27 % less often than the yearly averagereported 34 % less often than the yearly averagereported about as often as the yearly averagereported 37 % more often than the yearly averagereported 34 % more often than the yearly averagereported about as often as the yearly averagereported 20 % less often than the yearly averagereported about as often as the yearly averagereported about as often as the yearly averagereported 14 % more often than the yearly averagereported about as often as the yearly averagereported 19 % less often than the yearly average
Swedenreported 16 % more often than the yearly averagereported about as often as the yearly averagereported 12 % more often than the yearly averagereported 33 % more often than the yearly averagereported 19 % more often than the yearly averagereported 17 % less often than the yearly averagereported 26 % less often than the yearly averagereported 13 % less often than the yearly averagereported about as often as the yearly averagereported about as often as the yearly averagereported about as often as the yearly averagereported 13 % less often than the yearly average
United Kingdomreported about as often as the yearly averagereported about as often as the yearly averagereported 12 % more often than the yearly averagereported about as often as the yearly averagereported about as often as the yearly averagereported 15 % less often than the yearly averagereported 18 % less often than the yearly averagereported about as often as the yearly averagereported about as often as the yearly averagereported about as often as the yearly averagereported about as often as the yearly averagereported about as often as the yearly average
Norwayreported 10 % more often than the yearly averagereported about as often as the yearly averagereported 19 % more often than the yearly averagereported 31 % more often than the yearly averagereported 10 % more often than the yearly averagereported 26 % less often than the yearly averagereported 37 % less often than the yearly averagereported 19 % less often than the yearly averagereported about as often as the yearly averagereported about as often as the yearly averagereported about as often as the yearly averagereported about as often as the yearly average
Francereported 30 % more often than the yearly averagereported about as often as the yearly averagereported 21 % more often than the yearly averagereported 36 % more often than the yearly averagereported 20 % more often than the yearly averagereported 18 % less often than the yearly averagereported 31 % less often than the yearly averagereported 23 % less often than the yearly averagereported 13 % less often than the yearly averagereported 13 % less often than the yearly averagereported 17 % less often than the yearly averagereported about as often as the yearly average
Spainreported about as often as the yearly averagereported about as often as the yearly averagereported 17 % more often than the yearly averagereported 18 % more often than the yearly averagereported about as often as the yearly averagereported 20 % less often than the yearly averagereported 23 % less often than the yearly averagereported 12 % less often than the yearly averagereported about as often as the yearly averagereported about as often as the yearly averagereported about as often as the yearly averagereported about as often as the yearly average
Germanyreported about as often as the yearly averagereported about as often as the yearly averagereported 10 % more often than the yearly averagereported 14 % more often than the yearly averagereported 14 % more often than the yearly averagereported 17 % less often than the yearly averagereported 24 % less often than the yearly averagereported 11 % less often than the yearly averagereported about as often as the yearly averagereported about as often as the yearly averagereported about as often as the yearly averagereported about as often as the yearly average
much less oftenless oftenno clear differencemore oftenmuch more often

In the USA in April: reported 20 % more often than the yearly average. This is the strongest month there.

Who is reported in the same cells

In how many of 10 areas of this species the other species was reported as well. Counted are the 14,497 cells in which this species is reported regularly; compared with the other species that have a page.

Latest reports on the map

The map shows every cell with reports of this species, including the latest ones, and every other species as well.

View the Mallard on the map