Where the species is at home
Tinted green are the 2 countries where the species occurs according to the scientific literature.
Country list: Mammal Diversity Database.
 Wildpulse Map
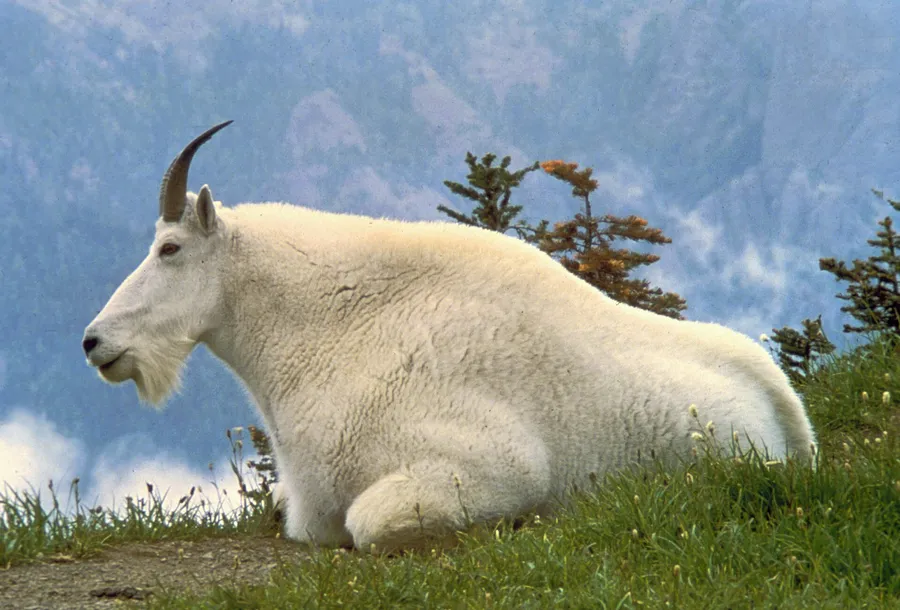
Oreamnos americanus
The mountain goat is a white, shaggy hoofed mammal of North America's mountains; both sexes have a beard and black horns. Despite its name it is not a true goat, though it belongs to the same wider group. It lives on sheer cliffs in the northern Rocky Mountains and feeds on grasses, leaves, conifer needles, mosses and lichens. Its split hooves can spread apart and have grippy inner pads, making it a superb climber on near-vertical rock.
In our data the species was reported on 722 days in 2 countries, most often in the USA and Canada.
Last reported on October 30, 2026 in Canada (British Columbia)
Photo: Dave Grickson/USFWS, Public domain
The area of each dot matches the weight.
On average 18 km². The circle shows this area at the same scale as the city. Choose a city or tap the picture to move the circle.
Toronto is as big as 36 home ranges.
Toronto: 662 km². Home range: 18 km², as a circle 4.8 km across. One square in the grid is 10 km wide.
The species does not necessarily live in these cities; the comparison only shows the size. 18 km² is an average from the scientific literature (COMBINE). Real home ranges are not round and can be much smaller or larger depending on the region.
Tinted green are the 2 countries where the species occurs according to the scientific literature.
Country list: Mammal Diversity Database.
Each hexagon is a cell about 40 km across in which people reported the species. The darker, the more days.
Where it stays pale, few reports come in. That does not mean the species is absent there. The latest reports pulse:
For each country, the place where the species was reported on the most days. Tap a place.
This is no promise. It shows where people report it especially often.
The species is most likely to be reported in July (42 % more often than the yearly average), least often in February (95 % less often). The bars show the difference from the yearly average, adjusted for the fact that more people are outdoors in summer. On the map, a cell is darker the more of its reports fall in the month shown.
January: 30 % more often than the yearly average.
Green means: in this month the species is reported there clearly more often than in the rest of the year. Blue means: clearly less often. We have adjusted for the fact that more people are outdoors in summer. Tap a square.
| J | F | M | A | M | J | J | A | S | O | N | D | |
|---|---|---|---|---|---|---|---|---|---|---|---|---|
| All countries | ||||||||||||
| USA | ||||||||||||
| Canada |
In the USA in August: reported 58 % more often than the yearly average. This is the strongest month there.
In how many of 10 areas of this species the other species was reported as well. Counted are the 64 cells in which this species is reported regularly; compared with the other species that have a page.
The map shows every cell with reports of this species, including the latest ones, and every other species as well.
View the Mountain Goat on the map