Wildpulse Map
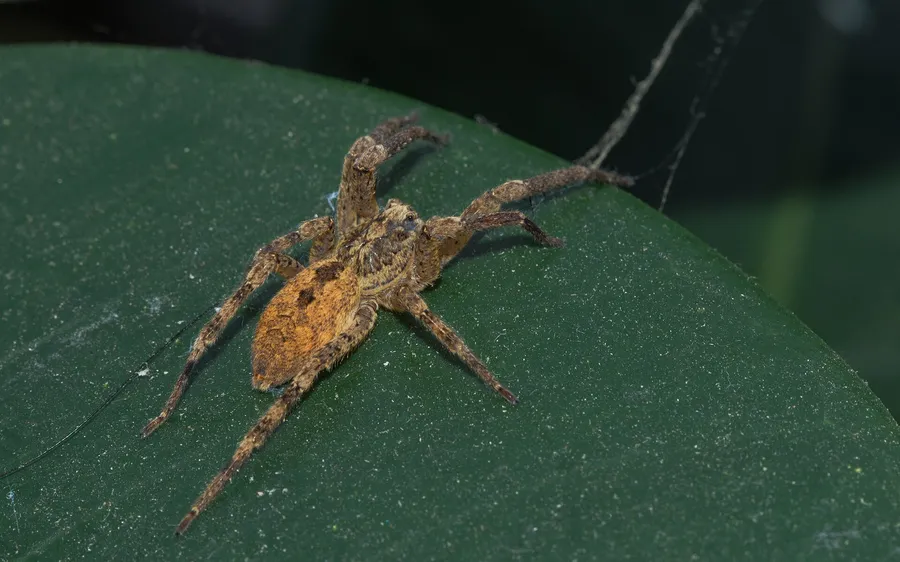
Photo: Nosferatu Spider

Nosferatu Spider

Zoropsis spinimana

This large spider is often called the Nosferatu spider because the dark markings on its pale front body resemble a vampire's face. Originally from the Mediterranean region, it has spread north into central Europe, where it has so far turned up mainly inside houses. Instead of spinning a web it hunts freely, grabbing small prey with a quick strike. Adhesive hairs on its feet let it climb even glass, and its bite can pierce human skin.

In our data the species was reported on 32,949 days in 21 countries, most often in Germany, France and Switzerland.

Last reported on November 21, 2026 in the Netherlands (South Holland)

View on the map

Photo: Christian Ferrer, CC BY-SA 3.0

Where the species lives and is reported

Drag to turn the globe

Where it is reported

Most reports come from Europe (100 %).

Counted are reporting days: days on which the species was reported at least once in a cell.

Where it was reported

Each hexagon is a cell about 40 km across in which people reported the species. The darker, the more days.

  • 32,949reporting days
  • 749cells
  • 21countries

Where it stays pale, few reports come in. That does not mean the species is absent there. The latest reports pulse:

  • South Holland, Netherlands
  • Faro, Portugal
  • Rhineland-Palatinate, Germany
  • California, USA

Where it is reported most often

For each country, the place where the species was reported on the most days. Tap a place.

This is no promise. It shows where people report it especially often.

Through the year

The species is most likely to be reported in December (107 % more often than the yearly average), least often in June (67 % less often). The bars show the difference from the yearly average, adjusted for the fact that more people are outdoors in summer. On the map, a cell is darker the more of its reports fall in the month shown.

January: 72 % more often than the yearly average.

When is the species reported where?

Green means: in this month the species is reported there clearly more often than in the rest of the year. Blue means: clearly less often. We have adjusted for the fact that more people are outdoors in summer. Tap a square.

How often the species is reported per country and month, compared with the yearly average
CountryJFMAMJJASOND
All countriesreported 72 % more often than the yearly averagereported 73 % more often than the yearly averagereported 33 % more often than the yearly averagereported 17 % less often than the yearly averagereported 55 % less often than the yearly averagereported 67 % less often than the yearly averagereported 54 % less often than the yearly averagereported 21 % less often than the yearly averagereported 48 % more often than the yearly averagereported 82 % more often than the yearly averagereported 2 times as often as the yearly averagereported 2.1 times as often as the yearly average
Germanyreported 76 % more often than the yearly averagereported 61 % more often than the yearly averagereported 21 % more often than the yearly averagereported 11 % less often than the yearly averagereported 47 % less often than the yearly averagereported 64 % less often than the yearly averagereported 49 % less often than the yearly averagereported 24 % less often than the yearly averagereported 31 % more often than the yearly averagereported 65 % more often than the yearly averagereported 80 % more often than the yearly averagereported 79 % more often than the yearly average
Francereported 74 % more often than the yearly averagereported 2.2 times as often as the yearly averagereported 60 % more often than the yearly averageno clear difference from the yearly averagereported 61 % less often than the yearly averagereported 65 % less often than the yearly averagereported 54 % less often than the yearly averagereported 21 % less often than the yearly averagereported 45 % more often than the yearly averagereported 2.1 times as often as the yearly averagereported 2.3 times as often as the yearly averagereported 2.6 times as often as the yearly average
Switzerlandreported 2.3 times as often as the yearly averagereported 69 % more often than the yearly averagereported 55 % more often than the yearly averageno clear difference from the yearly averagereported 53 % less often than the yearly averagereported 70 % less often than the yearly averagereported 71 % less often than the yearly averagereported 43 % less often than the yearly averagereported 41 % more often than the yearly averagereported 2.1 times as often as the yearly averagereported 2.7 times as often as the yearly averagereported 2.8 times as often as the yearly average
Austriareported 3.6 times as often as the yearly averagereported about as often as the yearly averageno clear difference from the yearly averagereported about as often as the yearly averagereported 65 % less often than the yearly averagereported 86 % less often than the yearly averagereported 73 % less often than the yearly averageno clear difference from the yearly averagereported 69 % more often than the yearly averagereported 2.4 times as often as the yearly averagereported 2.1 times as often as the yearly averagereported 3.5 times as often as the yearly average
Belgiumno clear difference from the yearly averageno clear difference from the yearly averageno clear difference from the yearly averageno clear difference from the yearly averagereported 49 % less often than the yearly averagereported 74 % less often than the yearly averageno clear difference from the yearly averageno clear difference from the yearly averageno clear difference from the yearly averagereported 2 times as often as the yearly averagereported 2.6 times as often as the yearly averagereported about as often as the yearly average
Netherlandsreported 3 times as often as the yearly averageno clear difference from the yearly averagereported 3.1 times as often as the yearly averagereported about as often as the yearly averagereported 57 % less often than the yearly averagereported 79 % less often than the yearly averagereported 85 % less often than the yearly averageno clear difference from the yearly averageno clear difference from the yearly averagereported 72 % more often than the yearly averagereported 3.2 times as often as the yearly averagereported 2.9 times as often as the yearly average
Italyno clear difference from the yearly averagereported 3.4 times as often as the yearly averageno clear difference from the yearly averagereported about as often as the yearly averagereported 59 % less often than the yearly averageno clear difference from the yearly averagereported 64 % less often than the yearly averageno clear difference from the yearly averageno clear difference from the yearly averagereported 2.1 times as often as the yearly averagereported 2.4 times as often as the yearly averageno clear difference from the yearly average
United Kingdomno clear difference from the yearly averageno clear difference from the yearly averageno clear difference from the yearly averageno clear difference from the yearly averageno clear difference from the yearly averageno clear difference from the yearly averagereported about as often as the yearly averagereported about as often as the yearly averageno clear difference from the yearly averageno clear difference from the yearly averageno clear difference from the yearly averagereported about as often as the yearly average
much less oftenless oftenno clear differencemore oftenmuch more often

In Germany in November: reported 80 % more often than the yearly average. This is the strongest month there.

Who is reported in the same cells

In how many of 10 areas of this species the other species was reported as well. Counted are the 487 cells in which this species is reported regularly; compared with the other species that have a page.

Latest reports on the map

The map shows every cell with reports of this species, including the latest ones, and every other species as well.

View the Nosferatu Spider on the map