Wildpulse Map
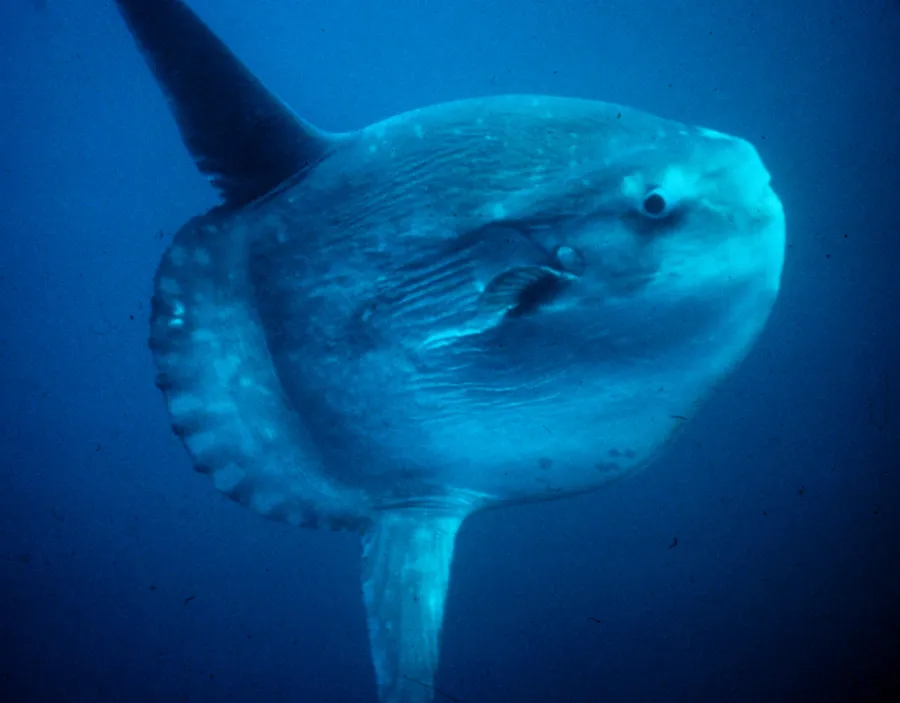
Photo: Ocean Sunfish

Ocean Sunfish

Mola mola

The ocean sunfish is a huge, flattened bony fish that looks like a fish head without a tail; in place of a tail fin it has a lumpy flap called the clavus. With its tall dorsal and anal fins it can be as tall as it is long, and record specimens have exceeded three metres and two tonnes. It roams the open ocean and eats jellyfish and salps, but genetic studies show it also takes many small fish, squid and crustaceans. A female can release up to 300 million eggs at once, more than any other known vertebrate.

In our data the species was reported on 4,780 days in 26 countries, most often in the USA, France and Portugal.

Last reported on September 20, 2026 in Canada (British Columbia)

View on the map

Photo: U.S. National Oceanic and Atmospheric Administration, Public domain

Where the species lives and is reported

Drag to turn the globe

Where it is reported

Most reports come from North America (66 %) and from Europe (34 %).

Counted are reporting days: days on which the species was reported at least once in a cell.

Where it was reported

Each hexagon is a cell about 40 km across in which people reported the species. The darker, the more days.

  • 4,780reporting days
  • 836cells
  • 26countries

Where it stays pale, few reports come in. That does not mean the species is absent there. The latest reports pulse:

  • British Columbia, Canada
  • Halland, Sweden
  • Washington, USA
  • Wicklow, Ireland

Where it is reported most often

For each country, the place where the species was reported on the most days. Tap a place.

This is no promise. It shows where people report it especially often.

Through the year

The species is most likely to be reported in August (57 % more often than the yearly average), least often in March (81 % less often). The bars show the difference from the yearly average, adjusted for the fact that more people are outdoors in summer. On the map, a cell is darker the more of its reports fall in the month shown.

January: 34 % less often than the yearly average.

When is the species reported where?

Green means: in this month the species is reported there clearly more often than in the rest of the year. Blue means: clearly less often. We have adjusted for the fact that more people are outdoors in summer. Tap a square.

How often the species is reported per country and month, compared with the yearly average
CountryJFMAMJJASOND
All countriesreported 34 % less often than the yearly averagereported 31 % less often than the yearly averagereported 81 % less often than the yearly averagereported 62 % less often than the yearly averagereported about as often as the yearly averagereported about as often as the yearly averageno clear difference from the yearly averagereported 57 % more often than the yearly averagereported 39 % more often than the yearly averageno clear difference from the yearly averagereported about as often as the yearly averageno clear difference from the yearly average
USAreported 93 % less often than the yearly averagereported 46 % less often than the yearly averagereported 94 % less often than the yearly averagereported 95 % less often than the yearly averagereported 78 % less often than the yearly averagereported 67 % less often than the yearly averageno clear difference from the yearly averagereported 2.2 times as often as the yearly averagereported 2.1 times as often as the yearly averagereported 38 % more often than the yearly averagereported about as often as the yearly averagereported about as often as the yearly average
Franceno clear difference from the yearly averageno clear difference from the yearly averagereported 80 % less often than the yearly averagereported 74 % less often than the yearly averagereported 83 % more often than the yearly averagereported 36 % more often than the yearly averagereported 67 % more often than the yearly averageno clear difference from the yearly averagereported 56 % less often than the yearly averagereported 72 % less often than the yearly averagereported 61 % less often than the yearly averagereported about as often as the yearly average
Portugalno clear difference from the yearly averagereported 4.4 times as often as the yearly averagereported 2.9 times as often as the yearly averagereported 4.5 times as often as the yearly averageno clear difference from the yearly averageno clear difference from the yearly averageno clear difference from the yearly averageno clear difference from the yearly averageno clear difference from the yearly averagereported 68 % less often than the yearly averagereported about as often as the yearly averageno clear difference from the yearly average
United Kingdomno clear difference from the yearly averageno clear difference from the yearly averageno clear difference from the yearly averageno clear difference from the yearly averageno clear difference from the yearly averageno clear difference from the yearly averagereported 2.3 times as often as the yearly averagereported 2.1 times as often as the yearly averageno clear difference from the yearly averageno clear difference from the yearly averageno clear difference from the yearly averageno clear difference from the yearly average
Spainno clear difference from the yearly averagereported about as often as the yearly averageno clear difference from the yearly averagereported 3.2 times as often as the yearly averagereported 3.4 times as often as the yearly averageno clear difference from the yearly averageno clear difference from the yearly averageno clear difference from the yearly averagereported 93 % less often than the yearly averageno clear difference from the yearly averageno clear difference from the yearly averageno clear difference from the yearly average
Irelandno clear difference from the yearly averageno clear difference from the yearly averageno clear difference from the yearly averageno clear difference from the yearly averageno clear difference from the yearly averagereported 2.9 times as often as the yearly averagereported 2.5 times as often as the yearly averagereported 2.7 times as often as the yearly averagereported about as often as the yearly averageno clear difference from the yearly averageno clear difference from the yearly averageno clear difference from the yearly average
Swedenreported 5.4 times as often as the yearly averageno clear difference from the yearly averageno clear difference from the yearly averageno clear difference from the yearly averageno clear difference from the yearly averageno clear difference from the yearly averageno clear difference from the yearly averageno clear difference from the yearly averageno clear difference from the yearly averageno clear difference from the yearly averagereported 3.6 times as often as the yearly averagereported 45 times as often as the yearly average
Canadano clear difference from the yearly averageno clear difference from the yearly averageno clear difference from the yearly averageno clear difference from the yearly averageno clear difference from the yearly averageno clear difference from the yearly averageno clear difference from the yearly averagereported 2.3 times as often as the yearly averagereported 3.5 times as often as the yearly averageno clear difference from the yearly averageno clear difference from the yearly averageno clear difference from the yearly average
much less oftenless oftenno clear differencemore oftenmuch more often

In the USA in August: reported 2.2 times as often as the yearly average. This is the strongest month there.

Who is reported in the same cells

In how many of 10 areas of this species the other species was reported as well. Counted are the 309 cells in which this species is reported regularly; compared with the other species that have a page.

Latest reports on the map

The map shows every cell with reports of this species, including the latest ones, and every other species as well.

View the Ocean Sunfish on the map