Wildpulse Map
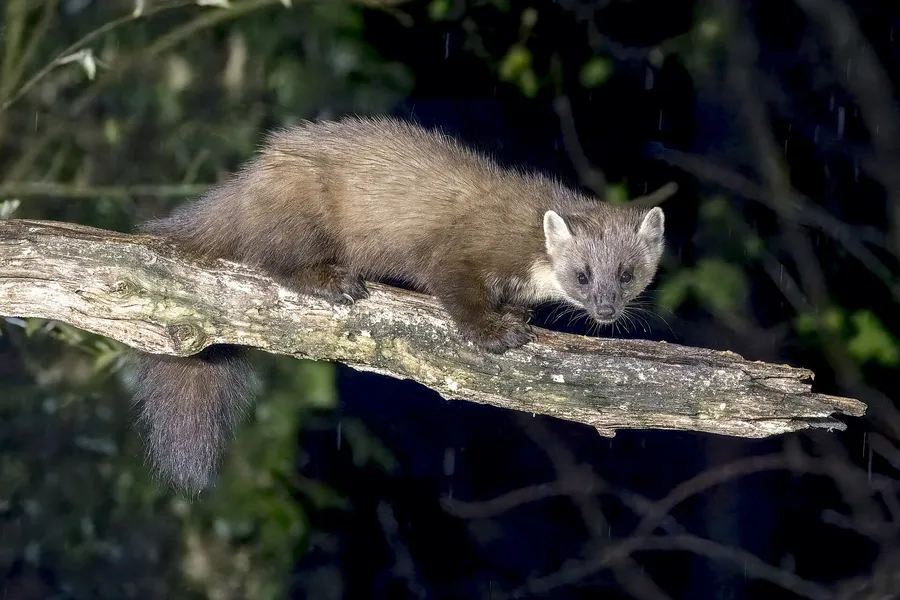
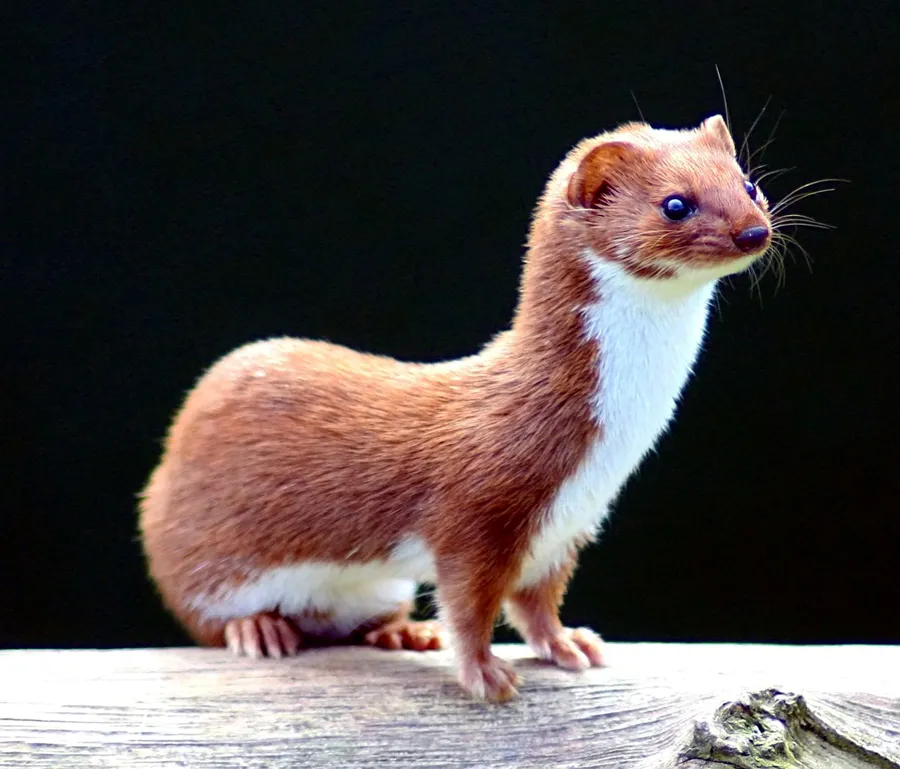
Photo: Pine Marten

Pine Marten

Martes martes

The pine marten is a slender, brown member of the weasel family with a creamy to yellowish throat patch; the related beech marten has a white one. It lives in forests across Europe and parts of western Asia and, unlike the beech marten, keeps away from towns and villages. At night it hunts voles, squirrels and birds, and in autumn it also eats berries and nuts. An agile climber, it spends the day resting in tree holes or old squirrel nests.

In our data the species was reported on 45,746 days in 34 countries, most often in France, Sweden and Switzerland.

Last reported on November 17, 2026 in Estonia (Lääne-Viru)

View on the map

Photo: Charles J. Sharp, CC BY-SA 4.0

Size and way of life

Size comparison: Pine Marten, head-and-body length 52 cm, next to a person 1.75 m tall.50 cm1 m1.5 m 52 cm1.75 m
Head and body, average for adults. The outline is scaled to this length and only approximate. The person next to it is 1.75 m tall.
Weight
1.3 kgaverage for adults
Length
52 cmhead and body, without tail
Home range
2.1 km²average size of the area an animal lives in
Young
4 youngper litter, after a gestation of 31 days
Active
at nightmainly nocturnal
Altitude
up to 2,300 mabove sea level
Maximum age
18 yearsoldest recorded age

From birth to old age

  1. 30 gat birth
  2. 680 gat 57 days, when the young are weaned
  3. 1.3 kgfully grown; able to breed at 17 months
  4. 18 yearsoldest recorded age

The area of each dot matches the weight.

How big a home range is

On average 2.2 km². The circle shows this area at the same scale as the city. Choose a city or tap the picture to move the circle.

Toronto is as big as 308 home ranges.

Toronto: 662 km². Home range: 2.2 km², as a circle 1.7 km across. One square in the grid is 10 km wide.

The species does not necessarily live in these cities; the comparison only shows the size. 2.2 km² is an average from the scientific literature (COMBINE). Real home ranges are not round and can be much smaller or larger depending on the region.

Outline of Toronto (662 km²) with a circle of 2.2 km², the average home range, at the same scale. 2.2 km²

Where the species lives and is reported

Drag to turn the globe
Country where it occurs

Where the species is at home

Tinted green are the 47 countries where the species occurs according to the scientific literature.

Country list: Mammal Diversity Database.

Where it was reported

Each hexagon is a cell about 40 km across in which people reported the species. The darker, the more days.

  • 45,746reporting days
  • 1,853cells
  • 34countries

Where it stays pale, few reports come in. That does not mean the species is absent there. The latest reports pulse:

  • Lääne-Viru, Estonia
  • Highland, United Kingdom
  • Balearic Islands, Spain
  • Haute-Savoie, France

Where it is reported most often

For each country, the place where the species was reported on the most days. Tap a place.

This is no promise. It shows where people report it especially often.

Through the year

The species is most likely to be reported in January (77 % more often than the yearly average), least often in November (40 % less often). The bars show the difference from the yearly average, adjusted for the fact that more people are outdoors in summer. On the map, a cell is darker the more of its reports fall in the month shown.

January: 77 % more often than the yearly average.

When is the species reported where?

Green means: in this month the species is reported there clearly more often than in the rest of the year. Blue means: clearly less often. We have adjusted for the fact that more people are outdoors in summer. Tap a square.

How often the species is reported per country and month, compared with the yearly average
CountryJFMAMJJASOND
All countriesreported 77 % more often than the yearly averagereported 17 % less often than the yearly averagereported about as often as the yearly averagereported about as often as the yearly averagereported about as often as the yearly averagereported 35 % more often than the yearly averagereported 10 % more often than the yearly averagereported 14 % less often than the yearly averagereported 18 % less often than the yearly averagereported 32 % less often than the yearly averagereported 40 % less often than the yearly averagereported 33 % less often than the yearly average
Francereported 2.6 times as often as the yearly averagereported 34 % less often than the yearly averagereported 22 % less often than the yearly averagereported 20 % less often than the yearly averagereported about as often as the yearly averagereported 24 % more often than the yearly averagereported about as often as the yearly averagereported about as often as the yearly averagereported 17 % less often than the yearly averagereported 30 % less often than the yearly averagereported 42 % less often than the yearly averagereported 44 % less often than the yearly average
Swedenreported 28 % less often than the yearly averageno clear difference from the yearly averagereported about as often as the yearly averagereported about as often as the yearly averagereported 28 % more often than the yearly averagereported 65 % more often than the yearly averagereported about as often as the yearly averagereported 38 % less often than the yearly averagereported about as often as the yearly averageno clear difference from the yearly averagereported 28 % less often than the yearly averagereported 34 % less often than the yearly average
Switzerlandreported 38 % more often than the yearly averageno clear difference from the yearly averagereported 46 % more often than the yearly averagereported 22 % more often than the yearly averagereported 17 % less often than the yearly averagereported 19 % more often than the yearly averagereported about as often as the yearly averageno clear difference from the yearly averagereported 20 % less often than the yearly averagereported 30 % less often than the yearly averagereported 38 % less often than the yearly averagereported about as often as the yearly average
United Kingdomreported 28 % less often than the yearly averageno clear difference from the yearly averagereported about as often as the yearly averagereported 21 % more often than the yearly averagereported 36 % more often than the yearly averagereported 21 % more often than the yearly averagereported 31 % more often than the yearly averagereported about as often as the yearly averagereported about as often as the yearly averagereported 28 % less often than the yearly averagereported 30 % less often than the yearly averagereported 39 % less often than the yearly average
Irelandreported about as often as the yearly averagereported 30 % less often than the yearly averagereported about as often as the yearly averagereported about as often as the yearly averagereported 24 % more often than the yearly averagereported 45 % more often than the yearly averagereported 30 % more often than the yearly averageno clear difference from the yearly averagereported 46 % less often than the yearly averagereported 48 % less often than the yearly averagereported 30 % less often than the yearly averageno clear difference from the yearly average
Norwayreported 78 % more often than the yearly averagereported 54 % more often than the yearly averagereported 28 % more often than the yearly averagereported about as often as the yearly averagereported 19 % more often than the yearly averagereported about as often as the yearly averagereported 41 % less often than the yearly averagereported 66 % less often than the yearly averagereported 55 % less often than the yearly averagereported 34 % less often than the yearly averagereported about as often as the yearly averagereported 48 % more often than the yearly average
Germanyno clear difference from the yearly averagereported about as often as the yearly averageno clear difference from the yearly averageno clear difference from the yearly averagereported 46 % more often than the yearly averagereported 2 times as often as the yearly averagereported about as often as the yearly averageno clear difference from the yearly averageno clear difference from the yearly averagereported 57 % less often than the yearly averagereported 63 % less often than the yearly averagereported 61 % less often than the yearly average
Belgiumreported 60 % less often than the yearly averagereported about as often as the yearly averageno clear difference from the yearly averageno clear difference from the yearly averagereported 53 % more often than the yearly averagereported 90 % more often than the yearly averageno clear difference from the yearly averagereported about as often as the yearly averageno clear difference from the yearly averagereported 52 % less often than the yearly averagereported 74 % less often than the yearly averagereported 62 % less often than the yearly average
much less oftenless oftenno clear differencemore oftenmuch more often

In France in January: reported 2.6 times as often as the yearly average. This is the strongest month there.

Who is reported in the same cells

In how many of 10 areas of this species the other species was reported as well. Counted are the 1,246 cells in which this species is reported regularly; compared with the other species that have a page.

Latest reports on the map

The map shows every cell with reports of this species, including the latest ones, and every other species as well.

View the Pine Marten on the map