Where it is reported
Most reports come from Oceania (98 %).
Counted are reporting days: days on which the species was reported at least once in a cell.
 Wildpulse Map
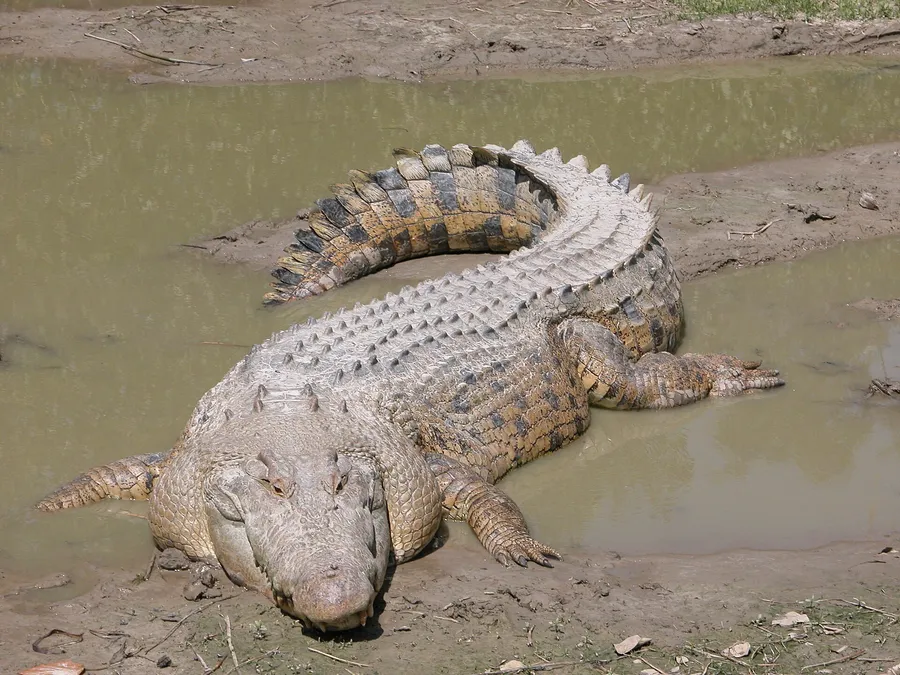
Crocodylus porosus
No living reptile is bigger than the saltwater crocodile, and old males can reach five to six metres. A pair of ridges runs from its eyes along the centre of its broad snout. It inhabits estuaries, mangroves, rivers and swamps from India's east coast through Southeast Asia to northern Australia, and it can swim long distances out at sea. It will take almost any animal that enters its territory, from fish and crabs to birds and large mammals, and it is regarded as dangerous to humans.
In our data the species was reported on 10,207 days in 8 countries, most often in Australia, Malaysia and Singapore.
Last reported on November 14, 2026 in Singapore (South West Community Development Council)
Photo: Obtained from Molly Ebersold of the St. Augustine Alligator Farm, Public domain
The area of each dot matches the weight.
Most reports come from Oceania (98 %).
Counted are reporting days: days on which the species was reported at least once in a cell.
Each hexagon is a cell about 40 km across in which people reported the species. The darker, the more days.
Where it stays pale, few reports come in. That does not mean the species is absent there. The latest reports pulse:
For each country, the place where the species was reported on the most days. Tap a place.
This is no promise. It shows where people report it especially often.
The species is most likely to be reported in December (12 % more often than the yearly average), least often in October (11 % less often). The bars show the difference from the yearly average, adjusted for the fact that more people are outdoors in summer. On the map, a cell is darker the more of its reports fall in the month shown.
January: about as often as the yearly average.
Green means: in this month the species is reported there clearly more often than in the rest of the year. Blue means: clearly less often. We have adjusted for the fact that more people are outdoors in summer. Tap a square.
| J | F | M | A | M | J | J | A | S | O | N | D | |
|---|---|---|---|---|---|---|---|---|---|---|---|---|
| All countries | ||||||||||||
| Australia | ||||||||||||
| Malaysia | ||||||||||||
| Singapore |
In Australia in March: reported 17 % more often than the yearly average. This is the strongest month there.
In how many of 10 areas of this species the other species was reported as well. Counted are the 89 cells in which this species is reported regularly; compared with the other species that have a page.
The map shows every cell with reports of this species, including the latest ones, and every other species as well.
View the Saltwater Crocodile on the map