Wildpulse Map
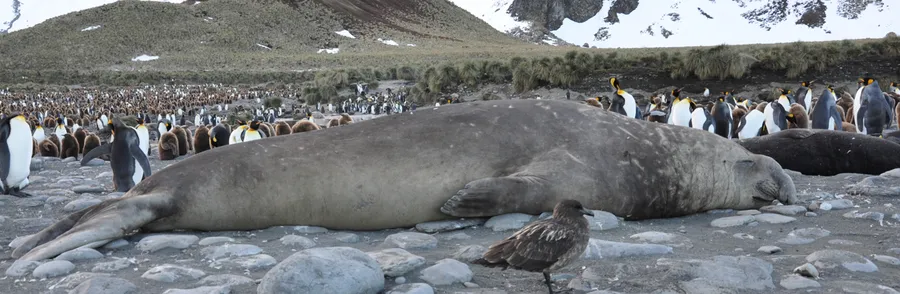
Photo: Southern Elephant Seal

Southern Elephant Seal

Mirounga leonina

The southern elephant seal is the largest seal on Earth. Bulls can reach about six metres and nearly four tonnes and have an inflatable, trunk-like nose, while females are far smaller. They spend most of their lives in the Southern Ocean, coming ashore on sub-Antarctic beaches to breed and moult. They feed on squid and fish and can dive deeper than 2,000 metres. On the breeding beaches, dominant bulls fight to control harems of dozens of females.

In our data the species was reported on 42,023 days in 12 countries, most often in Antarctica, French Southern and Antarctic Lands and New Zealand.

Last reported on November 21, 2026 in Antarctica (Antarctica)

View on the map

Photo: Butterfly voyages - Serge Ouachée, CC BY-SA 3.0

Size and way of life

Size comparison: Southern Elephant Seal, head-and-body length up to 6.34 m, next to a person 1.75 m tall.1 m2 m3 m up to 6.34 m1.75 m
Body length, average for adults. The outline is scaled to this length and only approximate. The person next to it is 1.75 m tall.
Weight
up to 1.4 tlarge adults
Length
up to 6.34 mbody length
Young
1 youngper litter, after a gestation of 8 months
Active
variesat night, at dusk or also by day
Maximum age
23 yearsoldest recorded age

From birth to old age

  1. 40 kgat birth
  2. 124 kgat 23 days, when the young are weaned
  3. 1.4 tfully grown; able to breed at 4 years
  4. 23 yearsoldest recorded age

The area of each dot matches the weight.

Where the species lives and is reported

Drag to turn the globe
Country where it occurs

Where the species is at home

Tinted green are the 19 countries where the species occurs according to the scientific literature.

Country list: Mammal Diversity Database.

Where it was reported

Each hexagon is a cell about 40 km across in which people reported the species. The darker, the more days.

  • 42,023reporting days
  • 8,651cells
  • 12countries

Where it stays pale, few reports come in. That does not mean the species is absent there. The latest reports pulse:

  • Antarctica, Antarctica
  • South Georgia and the South Sandwich Islands, South Georgia and the South Sandwich Islands
  • Buenos Aires, Argentina
  • Victoria, Australia

Where it is reported most often

For each country, the place where the species was reported on the most days. Tap a place.

This is no promise. It shows where people report it especially often.

Through the year

The species is most likely to be reported in May (20 % more often than the yearly average), least often in December (56 % less often). The bars show the difference from the yearly average, adjusted for the fact that more people are outdoors in summer. On the map, a cell is darker the more of its reports fall in the month shown.

January: 55 % less often than the yearly average.

When is the species reported where?

Green means: in this month the species is reported there clearly more often than in the rest of the year. Blue means: clearly less often. We have adjusted for the fact that more people are outdoors in summer. Tap a square.

How often the species is reported per country and month, compared with the yearly average
CountryJFMAMJJASOND
All countriesreported 55 % less often than the yearly averagereported 22 % less often than the yearly averagereported about as often as the yearly averagereported 16 % more often than the yearly averagereported 20 % more often than the yearly averagereported 18 % more often than the yearly averagereported 15 % more often than the yearly averagereported 15 % more often than the yearly averagereported 11 % more often than the yearly averagereported 12 % less often than the yearly averagereported 22 % less often than the yearly averagereported 56 % less often than the yearly average
Antarcticareported 54 % less often than the yearly averagereported 49 % less often than the yearly averagereported 23 % more often than the yearly averagereported 74 % more often than the yearly averagereported 44 % more often than the yearly averageno clear difference from the yearly averagereported 24 % less often than the yearly averagereported about as often as the yearly averagereported about as often as the yearly averagereported 59 % more often than the yearly averageno clear difference from the yearly averagereported 55 % less often than the yearly average
French Southern and Antarctic Landsreported about as often as the yearly averageno clear difference from the yearly averagereported about as often as the yearly averageno clear difference from the yearly averagereported about as often as the yearly averageno clear difference from the yearly averageno clear difference from the yearly averagereported about as often as the yearly averageno clear difference from the yearly averageno clear difference from the yearly averagereported about as often as the yearly averageno clear difference from the yearly average
New Zealandreported 64 % less often than the yearly averagereported 91 % less often than the yearly averageno clear difference from the yearly averageno clear difference from the yearly averagereported about as often as the yearly averageno clear difference from the yearly averageno clear difference from the yearly averageno clear difference from the yearly averagereported 2 times as often as the yearly averagereported 69 % more often than the yearly averageno clear difference from the yearly averagereported 70 % less often than the yearly average
Heard Island and McDonald Islandsreported 81 % less often than the yearly averageno clear difference from the yearly averageno clear difference from the yearly averageno clear difference from the yearly averageno clear difference from the yearly averageno clear difference from the yearly averageno clear difference from the yearly averageno clear difference from the yearly averageno clear difference from the yearly averageno clear difference from the yearly averagereported about as often as the yearly averageno reports
Australiareported 2.1 times as often as the yearly averagereported 2.2 times as often as the yearly averageno clear difference from the yearly averagereported 85 % less often than the yearly averageno clear difference from the yearly averagereported about as often as the yearly averageno clear difference from the yearly averageno clear difference from the yearly averageno clear difference from the yearly averagereported about as often as the yearly averageno clear difference from the yearly averageno clear difference from the yearly average
South Georgia and the South Sandwich Islandsno clear difference from the yearly averageno clear difference from the yearly averageno clear difference from the yearly averageno clear difference from the yearly averageno clear difference from the yearly averageno clear difference from the yearly averageno reportsno clear difference from the yearly averageno clear difference from the yearly averagereported 2.7 times as often as the yearly averagereported about as often as the yearly averageno clear difference from the yearly average
Argentinano clear difference from the yearly averagereported about as often as the yearly averageno clear difference from the yearly averageno clear difference from the yearly averageno clear difference from the yearly averageno clear difference from the yearly averageno clear difference from the yearly averageno clear difference from the yearly averageno clear difference from the yearly averageno clear difference from the yearly averageno clear difference from the yearly averagereported about as often as the yearly average
South Africano clear difference from the yearly averagereported 3 times as often as the yearly averageno clear difference from the yearly averagereported 2.2 times as often as the yearly averageno clear difference from the yearly averageno clear difference from the yearly averageno clear difference from the yearly averageno clear difference from the yearly averageno reportsno clear difference from the yearly averageno clear difference from the yearly averageno clear difference from the yearly average
much less oftenless oftenno clear differencemore oftenmuch more often

In Antarctica in April: reported 74 % more often than the yearly average. This is the strongest month there.

Latest reports on the map

The map shows every cell with reports of this species, including the latest ones, and every other species as well.

View the Southern Elephant Seal on the map