Where the species is at home
Tinted green are the 1 countries where the species occurs according to the scientific literature.
Country list: Mammal Diversity Database.
 Wildpulse Map
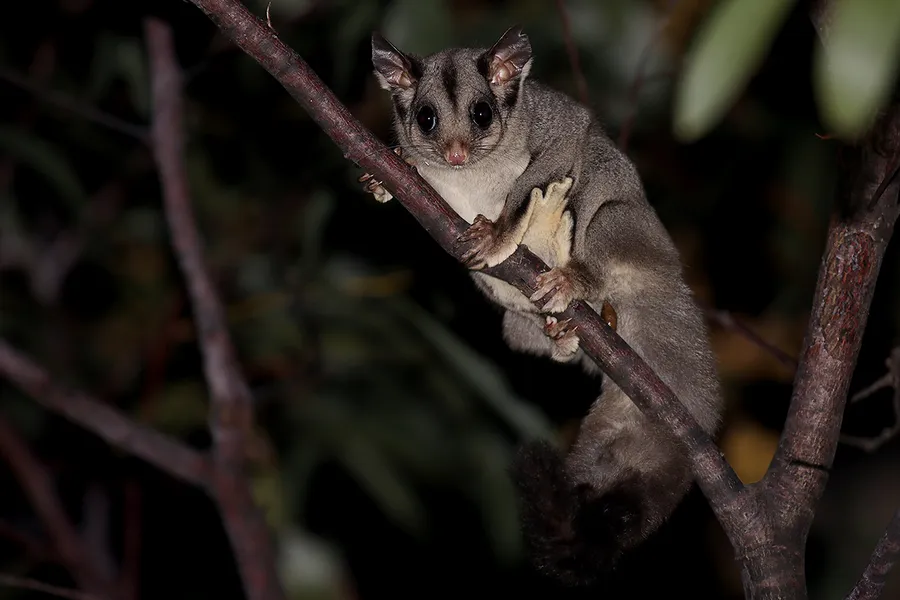
Petaurus breviceps
The sugar glider is a small grey marsupial with large eyes and a dark stripe running from its nose down its back. A furry membrane stretched between its front and hind legs lets it glide 50 metres or more from tree to tree. It is nocturnal and lives in small groups in forests of eastern and northern Australia and New Guinea. In summer it eats mostly insects, while in winter it feeds on eucalyptus sap and acacia gum.
In our data the species was reported on 14,734 days in 1 country, most often in Australia.
Last reported on September 30, 2026 in Australia (New South Wales)
Photo: patrickkavanagh, CC BY 2.0
The area of each dot matches the weight.
Tinted green are the 1 countries where the species occurs according to the scientific literature.
Country list: Mammal Diversity Database.
Each hexagon is a cell about 40 km across in which people reported the species. The darker, the more days.
Where it stays pale, few reports come in. That does not mean the species is absent there. The latest reports pulse:
For each country, the place where the species was reported on the most days. Tap a place.
This is no promise. It shows where people report it especially often.
The species is most likely to be reported in November (14 % more often than the yearly average), least often in April (16 % less often). The bars show the difference from the yearly average, adjusted for the fact that more people are outdoors in summer. On the map, a cell is darker the more of its reports fall in the month shown.
January: about as often as the yearly average.
Green means: in this month the species is reported there clearly more often than in the rest of the year. Blue means: clearly less often. We have adjusted for the fact that more people are outdoors in summer. Tap a square.
| J | F | M | A | M | J | J | A | S | O | N | D | |
|---|---|---|---|---|---|---|---|---|---|---|---|---|
| All countries | ||||||||||||
| Australia |
In Australia in November: reported 14 % more often than the yearly average. This is the strongest month there.
In how many of 10 areas of this species the other species was reported as well. Counted are the 180 cells in which this species is reported regularly; compared with the other species that have a page.
The map shows every cell with reports of this species, including the latest ones, and every other species as well.
View the Sugar Glider on the map