Wildpulse Map
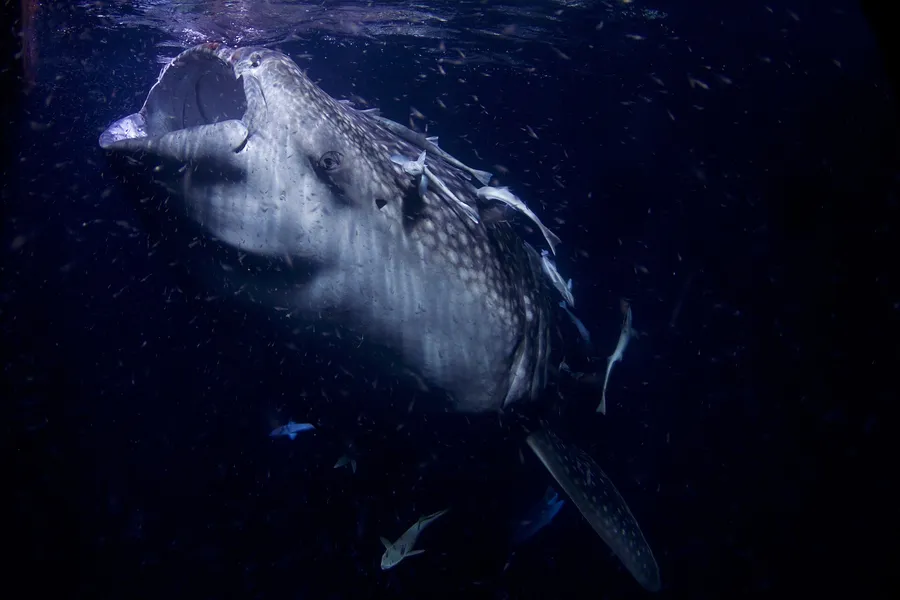
Photo: Whale Shark

Whale Shark

Rhincodon typus

The whale shark is the largest fish alive, a huge, slow-moving shark with a wide mouth and pale spots and stripes on its dark back. It roams warm tropical and subtropical seas, close to shore as well as far out at sea. Despite its size it feeds on plankton, small fish and squid, which it filters from the water it sucks in. Whale sharks travel thousands of kilometres and gather seasonally, sometimes in their hundreds, where food is plentiful; the species is listed as Endangered.

In our data the species was reported on 4,655 days in 17 countries, most often in Australia, Australian Indian Ocean Territories and Indonesia.

Last reported on August 1, 2026 in Australia (Western Australia)

View on the map

Photo: Arturo de Frias Marques, CC BY-SA 4.0

Size and way of life

Weight
12 tadults

Where the species lives and is reported

Drag to turn the globe

Where it is reported

Most reports come from Oceania (81 %) and from Asia (15 %).

Counted are reporting days: days on which the species was reported at least once in a cell.

Where it was reported

Each hexagon is a cell about 40 km across in which people reported the species. The darker, the more days.

  • 4,655reporting days
  • 1,371cells
  • 17countries

Where it stays pale, few reports come in. That does not mean the species is absent there. The latest reports pulse:

  • Western Australia, Australia
  • West Nusa Tenggara, Indonesia
  • Baja California Sur, Mexico
  • Masbate, Philippines

Where it is reported most often

For each country, the place where the species was reported on the most days. Tap a place.

This is no promise. It shows where people report it especially often.

Through the year

The species is most likely to be reported in December (44 % more often than the yearly average), least often in June (64 % less often). The bars show the difference from the yearly average, adjusted for the fact that more people are outdoors in summer. On the map, a cell is darker the more of its reports fall in the month shown.

January: 13 % more often than the yearly average.

When is the species reported where?

Green means: in this month the species is reported there clearly more often than in the rest of the year. Blue means: clearly less often. We have adjusted for the fact that more people are outdoors in summer. Tap a square.

How often the species is reported per country and month, compared with the yearly average
CountryJFMAMJJASOND
All countriesno clear difference from the yearly averagereported 20 % less often than the yearly averagereported 39 % less often than the yearly averagereported 37 % less often than the yearly averagereported 51 % less often than the yearly averagereported 64 % less often than the yearly averageno clear difference from the yearly averagereported 27 % more often than the yearly averagereported 43 % more often than the yearly averagereported 26 % more often than the yearly averagereported 29 % more often than the yearly averagereported 44 % more often than the yearly average
Australiano clear difference from the yearly averagereported 28 % less often than the yearly averagereported about as often as the yearly averagereported about as often as the yearly averagereported 39 % less often than the yearly averagereported 53 % less often than the yearly averagereported about as often as the yearly averagereported about as often as the yearly averagereported 33 % more often than the yearly averagereported 49 % more often than the yearly averageno clear difference from the yearly averagereported about as often as the yearly average
Australian Indian Ocean Territoriesno clear difference from the yearly averageno clear difference from the yearly averageno clear difference from the yearly averageno clear difference from the yearly averageno clear difference from the yearly averageno clear difference from the yearly averageno clear difference from the yearly averageno clear difference from the yearly averageno reportsno clear difference from the yearly averageno clear difference from the yearly averageno clear difference from the yearly average
Indonesiano clear difference from the yearly averageno clear difference from the yearly averageno clear difference from the yearly averageno clear difference from the yearly averagereported about as often as the yearly averagereported about as often as the yearly averageno clear difference from the yearly averageno clear difference from the yearly averageno clear difference from the yearly averageno clear difference from the yearly averageno clear difference from the yearly averageno clear difference from the yearly average
Mexicono clear difference from the yearly averageno clear difference from the yearly averageno clear difference from the yearly averageno clear difference from the yearly averageno clear difference from the yearly averageno clear difference from the yearly averagereported 2.5 times as often as the yearly averageno clear difference from the yearly averageno clear difference from the yearly averageno clear difference from the yearly averageno clear difference from the yearly averageno clear difference from the yearly average
much less oftenless oftenno clear differencemore oftenmuch more often

In Australia in October: reported 49 % more often than the yearly average. This is the strongest month there.

Latest reports on the map

The map shows every cell with reports of this species, including the latest ones, and every other species as well.

View the Whale Shark on the map