Where the species is at home
Tinted green are the 2 countries where the species occurs according to the scientific literature.
Country list: Mammal Diversity Database.
 Wildpulse Map
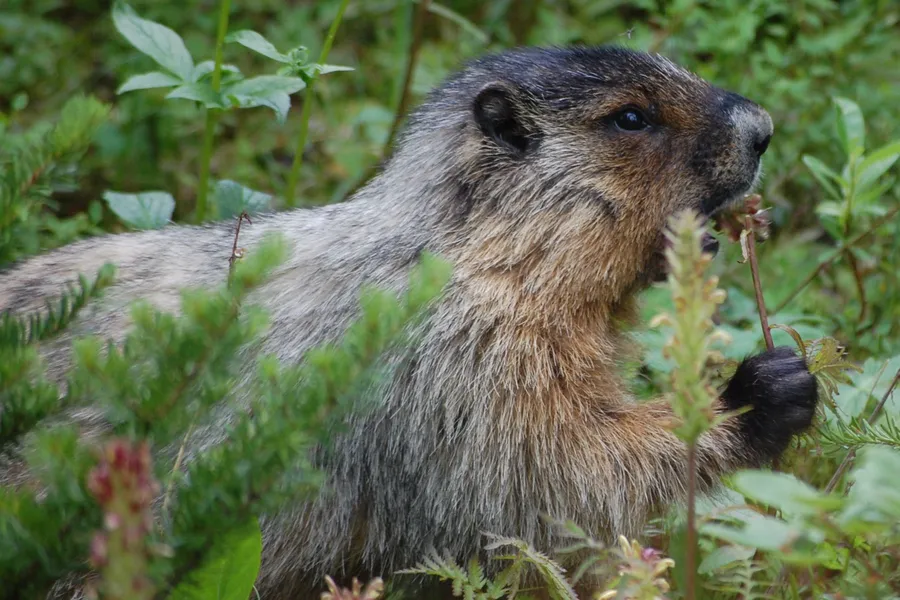
Marmota monax
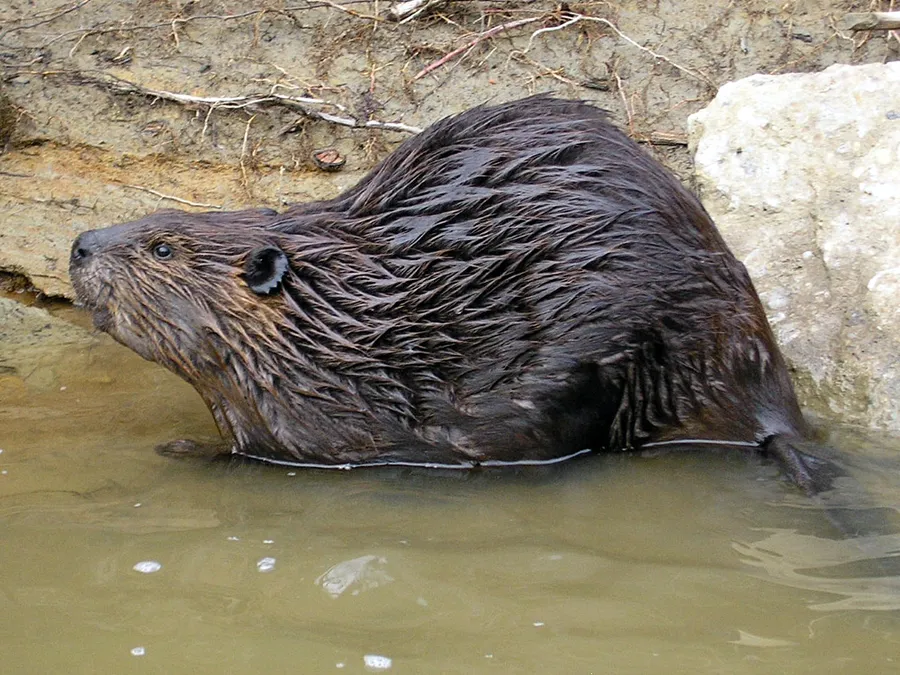
The groundhog, or woodchuck, is a large rodent of the squirrel family and, like the Alpine marmot, one of the marmots. Unlike its relatives in rocky and mountainous country, it lives in lowland North America, favouring open land and woodland edges and never straying far from its burrow. It eats mainly grasses and other plants, berries and crops. After fattening up in summer and autumn it hibernates, and the United States and Canada celebrate Groundhog Day in its honour on 2 February.
In our data the species was reported on 4,851 days in 2 countries, most often in the USA and Canada.
Last reported on November 18, 2026 in the USA (Ohio)
Photo: Reinhard Kraasch, CC BY-SA 4.0
The area of each dot matches the weight.
Tinted green are the 2 countries where the species occurs according to the scientific literature.
Country list: Mammal Diversity Database.
Each hexagon is a cell about 40 km across in which people reported the species. The darker, the more days.
Where it stays pale, few reports come in. That does not mean the species is absent there. The latest reports pulse:
For each country, the place where the species was reported on the most days. Tap a place.
This is no promise. It shows where people report it especially often.
The species is most likely to be reported in May (63 % more often than the yearly average), least often in January (97 % less often). The bars show the difference from the yearly average, adjusted for the fact that more people are outdoors in summer. On the map, a cell is darker the more of its reports fall in the month shown.
January: 97 % less often than the yearly average.
Green means: in this month the species is reported there clearly more often than in the rest of the year. Blue means: clearly less often. We have adjusted for the fact that more people are outdoors in summer. Tap a square.
| J | F | M | A | M | J | J | A | S | O | N | D | |
|---|---|---|---|---|---|---|---|---|---|---|---|---|
| All countries | ||||||||||||
| USA | ||||||||||||
| Canada |
In the USA in May: reported 54 % more often than the yearly average. This is the strongest month there.
In how many of 10 areas of this species the other species was reported as well. Counted are the 337 cells in which this species is reported regularly; compared with the other species that have a page.
The map shows every cell with reports of this species, including the latest ones, and every other species as well.
View the Woodchuck on the map