Where it is reported
Most reports come from North America (100 %).
Counted are reporting days: days on which the species was reported at least once in a cell.
 Wildpulse Map
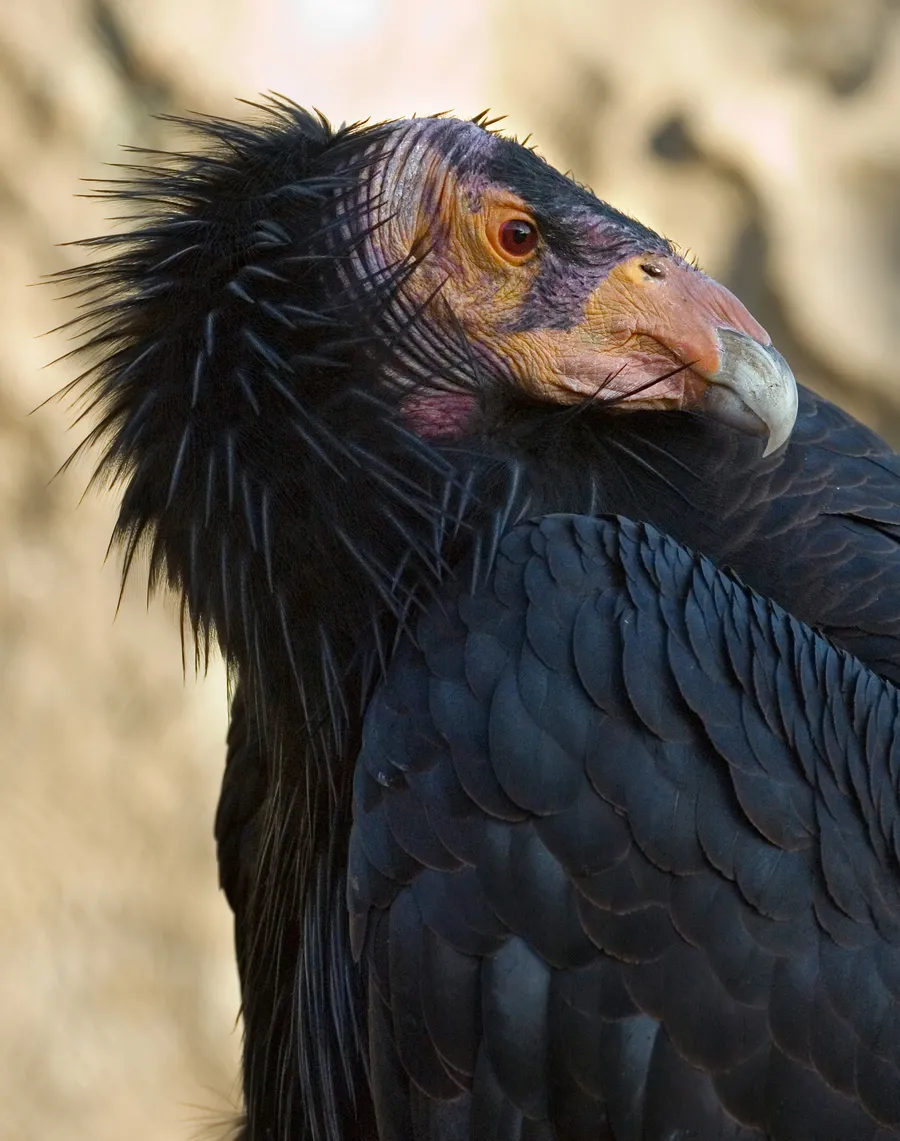
Gymnogyps californianus
The California condor is a huge black vulture with white patches under its wings and a bald head that turns yellow to bright orange in adults. No other North American bird has wings as broad, spanning about three metres from tip to tip. It feeds on carrion, soaring over mountains and coasts in western North America. In 1987 the last wild condor was captured, leaving only 27 birds; captive breeding has since returned condors to the wild in California, Arizona, Utah and Mexico.
In our data the species was reported on 12,376 days in 3 countries, most often in the USA, Mexico and Canada.
Last reported on November 5, 2026 in the USA (California)
Photo: Chuck Szmurlo, CC BY 3.0
The area of each dot matches the weight.
Most reports come from North America (100 %).
Counted are reporting days: days on which the species was reported at least once in a cell.
Each hexagon is a cell about 40 km across in which people reported the species. The darker, the more days.
Where it stays pale, few reports come in. That does not mean the species is absent there. The latest reports pulse:
For each country, the place where the species was reported on the most days. Tap a place.
This is no promise. It shows where people report it especially often.
The species is most likely to be reported in April (19 % more often than the yearly average), least often in December (21 % less often). The bars show the difference from the yearly average, adjusted for the fact that more people are outdoors in summer. On the map, a cell is darker the more of its reports fall in the month shown.
January: 16 % less often than the yearly average.
Green means: in this month the species is reported there clearly more often than in the rest of the year. Blue means: clearly less often. We have adjusted for the fact that more people are outdoors in summer. Tap a square.
| J | F | M | A | M | J | J | A | S | O | N | D | |
|---|---|---|---|---|---|---|---|---|---|---|---|---|
| All countries | ||||||||||||
| USA | ||||||||||||
| Mexico |
In the USA in April: reported 20 % more often than the yearly average. This is the strongest month there.
In how many of 10 areas of this species the other species was reported as well. Counted are the 56 cells in which this species is reported regularly; compared with the other species that have a page.
The map shows every cell with reports of this species, including the latest ones, and every other species as well.
View the California Condor on the map