Wildpulse Map
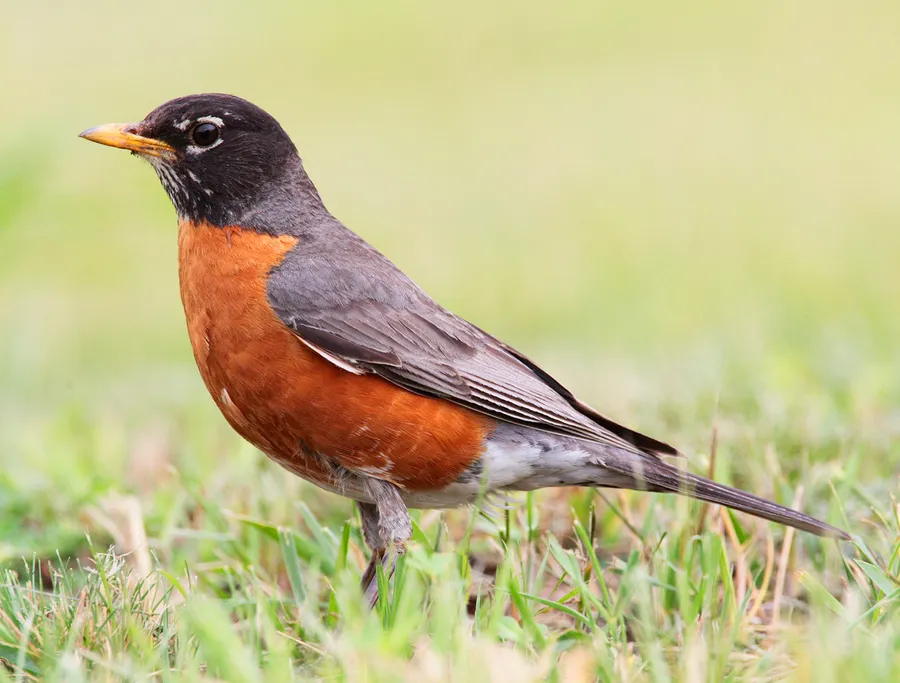
Photo: American Robin

American Robin

Turdus migratorius

The American robin is a North American thrush whose breast is reddish orange and whose back is brown; it takes its name from the European robin, although the two are not closely related. It breeds across almost all of North America, in open woodland as well as gardens, parks and cities. In spring and summer it eats mainly earthworms, beetle grubs and caterpillars, while in autumn and winter berries and other fruit make up most of its food. It lays its eggs earlier in the year than most other bird species.

In our data the species was reported on 5,090,965 days in 14 countries, most often in the USA, Canada and Mexico.

Last reported on November 22, 2026 in Canada (Ontario)

View on the map

Photo: en:User:Mdf, CC BY-SA 3.0

Where the species lives and is reported

Drag to turn the globe

Where it is reported

Most reports come from North America (100 %).

Counted are reporting days: days on which the species was reported at least once in a cell.

Where it was reported

Each hexagon is a cell about 40 km across in which people reported the species. The darker, the more days.

  • 5,090,965reporting days
  • 8,226cells
  • 14countries

Where it stays pale, few reports come in. That does not mean the species is absent there. The latest reports pulse:

  • Ontario, Canada
  • Quebec, Canada
  • Wisconsin, USA
  • Georgia, USA

Where it is reported most often

For each country, the place where the species was reported on the most days. Tap a place.

This is no promise. It shows where people report it especially often.

Through the year

The species is most likely to be reported in May (26 % more often than the yearly average), least often in December (28 % less often). The bars show the difference from the yearly average, adjusted for the fact that more people are outdoors in summer. On the map, a cell is darker the more of its reports fall in the month shown.

January: 25 % less often than the yearly average.

When is the species reported where?

Green means: in this month the species is reported there clearly more often than in the rest of the year. Blue means: clearly less often. We have adjusted for the fact that more people are outdoors in summer. Tap a square.

How often the species is reported per country and month, compared with the yearly average
CountryJFMAMJJASOND
All countriesreported 25 % less often than the yearly averagereported 16 % less often than the yearly averagereported about as often as the yearly averagereported 19 % more often than the yearly averagereported 26 % more often than the yearly averagereported 24 % more often than the yearly averagereported 15 % more often than the yearly averagereported about as often as the yearly averagereported 11 % less often than the yearly averagereported about as often as the yearly averagereported 19 % less often than the yearly averagereported 28 % less often than the yearly average
USAreported 18 % less often than the yearly averagereported about as often as the yearly averagereported about as often as the yearly averagereported 17 % more often than the yearly averagereported 21 % more often than the yearly averagereported 19 % more often than the yearly averagereported 11 % more often than the yearly averagereported 11 % less often than the yearly averagereported 14 % less often than the yearly averagereported about as often as the yearly averagereported 14 % less often than the yearly averagereported 22 % less often than the yearly average
Canadareported 63 % less often than the yearly averagereported 58 % less often than the yearly averagereported 23 % less often than the yearly averagereported 31 % more often than the yearly averagereported 46 % more often than the yearly averagereported 41 % more often than the yearly averagereported 31 % more often than the yearly averagereported about as often as the yearly averagereported about as often as the yearly averagereported about as often as the yearly averagereported 42 % less often than the yearly averagereported 60 % less often than the yearly average
Mexicoreported about as often as the yearly averagereported about as often as the yearly averagereported 19 % more often than the yearly averagereported 22 % more often than the yearly averagereported 28 % more often than the yearly averagereported 24 % more often than the yearly averagereported 13 % more often than the yearly averagereported 15 % less often than the yearly averagereported 37 % less often than the yearly averagereported 34 % less often than the yearly averagereported 19 % less often than the yearly averagereported 11 % less often than the yearly average
Saint Pierre and Miquelonreported 76 % less often than the yearly averagereported 57 % less often than the yearly averagereported 41 % less often than the yearly averagereported 49 % more often than the yearly averagereported 74 % more often than the yearly averagereported 32 % more often than the yearly averagereported about as often as the yearly averagereported about as often as the yearly averageno clear difference from the yearly averageno clear difference from the yearly averageno clear difference from the yearly averagereported 67 % less often than the yearly average
Bermudano clear difference from the yearly averagereported 3.9 times as often as the yearly averageno clear difference from the yearly averageno clear difference from the yearly averageno clear difference from the yearly averageno clear difference from the yearly averageno clear difference from the yearly averageno clear difference from the yearly averageno clear difference from the yearly averageno clear difference from the yearly averagereported 3 times as often as the yearly averageno clear difference from the yearly average
United Kingdomno clear difference from the yearly averagereported 7.3 times as often as the yearly averageno clear difference from the yearly averageno clear difference from the yearly averageno clear difference from the yearly averageno clear difference from the yearly averageno clear difference from the yearly averageno clear difference from the yearly averagereported 4.2 times as often as the yearly averageno clear difference from the yearly averageno clear difference from the yearly averageno clear difference from the yearly average
much less oftenless oftenno clear differencemore oftenmuch more often

In the USA in May: reported 21 % more often than the yearly average. This is the strongest month there.

Who is reported in the same cells

In how many of 10 areas of this species the other species was reported as well. Counted are the 7,259 cells in which this species is reported regularly; compared with the other species that have a page.

Latest reports on the map

The map shows every cell with reports of this species, including the latest ones, and every other species as well.

View the American Robin on the map