Wildpulse Map
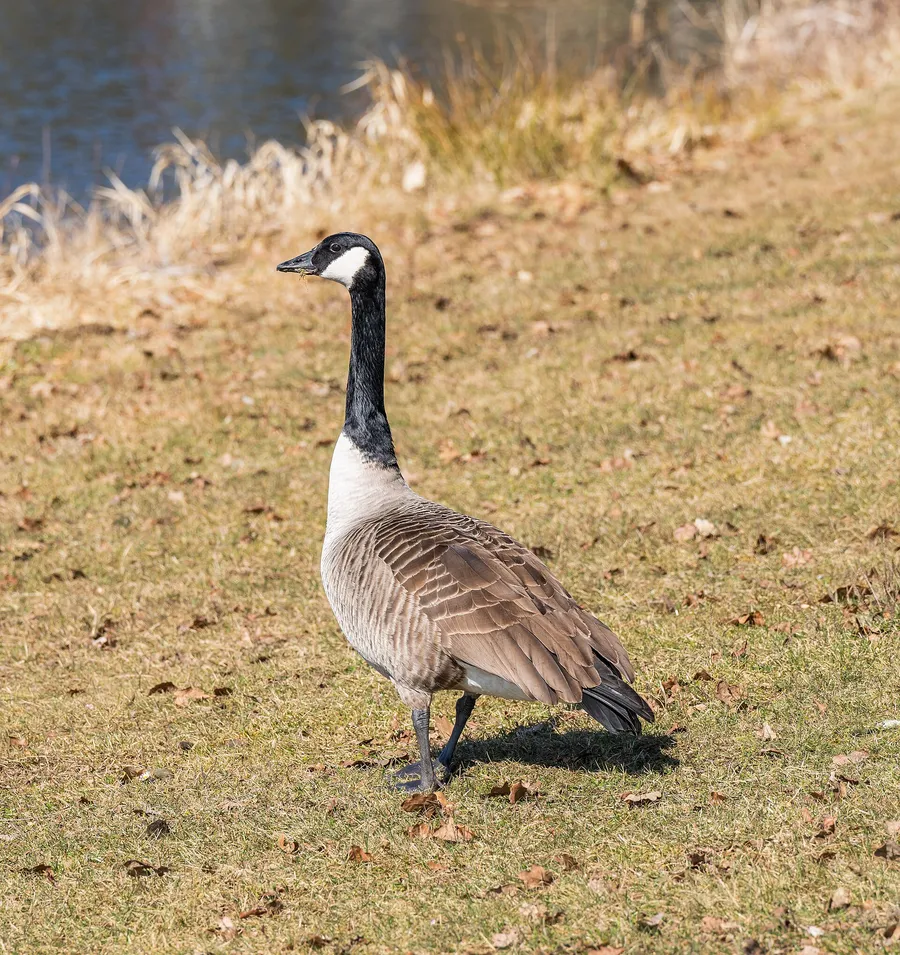
Photo: Canada Goose

Canada Goose

Branta canadensis

The Canada goose is a large goose with a black head and neck, a bold white chinstrap and a brownish body. Native to North America, it has been introduced to Europe, New Zealand, Japan and parts of South America, and it is now the largest goose living in the wild in Europe. It grazes mainly on grass and other plants. Its V-shaped migrating flocks mark the change of seasons in North America, while its success in parks has led many people to see it as a pest.

In our data the species was reported on 4,917,540 days in 55 countries, most often in the USA, Canada and Sweden.

Last reported on November 22, 2026 in the United Kingdom (Havering)

View on the map

Photo: PantheraLeo1359531, CC BY 4.0

Size and way of life

Wingspan
1.69 mfrom wingtip to wingtip

Where the species lives and is reported

Drag to turn the globe

Where it is reported

Most reports come from North America (81 %) and from Europe (18 %).

Counted are reporting days: days on which the species was reported at least once in a cell.

Where it was reported

Each hexagon is a cell about 40 km across in which people reported the species. The darker, the more days.

  • 4,917,540reporting days
  • 9,937cells
  • 55countries

Where it stays pale, few reports come in. That does not mean the species is absent there. The latest reports pulse:

  • Havering, United Kingdom
  • Manitoba, Canada
  • Texas, USA
  • New York, USA

Where it is reported most often

For each country, the place where the species was reported on the most days. Tap a place.

This is no promise. It shows where people report it especially often.

Through the year

The species is most likely to be reported in April (35 % more often than the yearly average), least often in July (26 % less often). The bars show the difference from the yearly average, adjusted for the fact that more people are outdoors in summer. On the map, a cell is darker the more of its reports fall in the month shown.

January: 12 % less often than the yearly average.

When is the species reported where?

Green means: in this month the species is reported there clearly more often than in the rest of the year. Blue means: clearly less often. We have adjusted for the fact that more people are outdoors in summer. Tap a square.

How often the species is reported per country and month, compared with the yearly average
CountryJFMAMJJASOND
All countriesreported 12 % less often than the yearly averagereported about as often as the yearly averagereported 24 % more often than the yearly averagereported 35 % more often than the yearly averagereported 22 % more often than the yearly averagereported 22 % less often than the yearly averagereported 26 % less often than the yearly averagereported 14 % less often than the yearly averagereported about as often as the yearly averagereported about as often as the yearly averagereported about as often as the yearly averagereported about as often as the yearly average
USAreported about as often as the yearly averagereported about as often as the yearly averagereported 24 % more often than the yearly averagereported 30 % more often than the yearly averagereported 18 % more often than the yearly averagereported 23 % less often than the yearly averagereported 25 % less often than the yearly averagereported 17 % less often than the yearly averagereported about as often as the yearly averagereported about as often as the yearly averagereported about as often as the yearly averagereported about as often as the yearly average
Canadareported 46 % less often than the yearly averagereported 47 % less often than the yearly averagereported about as often as the yearly averagereported 52 % more often than the yearly averagereported 42 % more often than the yearly averagereported 11 % less often than the yearly averagereported 32 % less often than the yearly averagereported 11 % less often than the yearly averagereported 21 % more often than the yearly averagereported 24 % more often than the yearly averagereported about as often as the yearly averagereported 31 % less often than the yearly average
Swedenreported 34 % less often than the yearly averagereported 19 % less often than the yearly averagereported 61 % more often than the yearly averagereported 65 % more often than the yearly averagereported 33 % more often than the yearly averagereported 27 % less often than the yearly averagereported 26 % less often than the yearly averagereported 11 % less often than the yearly averagereported 15 % less often than the yearly averagereported 12 % less often than the yearly averagereported about as often as the yearly averagereported 35 % less often than the yearly average
United Kingdomreported about as often as the yearly averagereported 13 % more often than the yearly averagereported 23 % more often than the yearly averagereported 21 % more often than the yearly averagereported about as often as the yearly averagereported 21 % less often than the yearly averagereported 20 % less often than the yearly averagereported about as often as the yearly averagereported about as often as the yearly averagereported about as often as the yearly averagereported about as often as the yearly averagereported about as often as the yearly average
Norwayreported 43 % less often than the yearly averagereported 43 % less often than the yearly averagereported 47 % more often than the yearly averagereported 82 % more often than the yearly averagereported 25 % more often than the yearly averagereported 29 % less often than the yearly averagereported 36 % less often than the yearly averagereported about as often as the yearly averagereported about as often as the yearly averagereported about as often as the yearly averagereported 16 % less often than the yearly averagereported 30 % less often than the yearly average
Germanyreported about as often as the yearly averagereported 12 % more often than the yearly averagereported 40 % more often than the yearly averagereported 43 % more often than the yearly averagereported 23 % more often than the yearly averagereported 29 % less often than the yearly averagereported 28 % less often than the yearly averagereported 20 % less often than the yearly averagereported 14 % less often than the yearly averagereported 14 % less often than the yearly averagereported 22 % less often than the yearly averagereported 15 % less often than the yearly average
Belgiumreported about as often as the yearly averagereported 28 % more often than the yearly averagereported 44 % more often than the yearly averagereported 38 % more often than the yearly averagereported 16 % more often than the yearly averagereported 27 % less often than the yearly averagereported 35 % less often than the yearly averagereported 31 % less often than the yearly averagereported 28 % less often than the yearly averagereported about as often as the yearly averagereported about as often as the yearly averagereported about as often as the yearly average
Francereported 39 % more often than the yearly averagereported about as often as the yearly averagereported 34 % more often than the yearly averagereported 48 % more often than the yearly averagereported 28 % more often than the yearly averagereported 25 % less often than the yearly averagereported 35 % less often than the yearly averagereported 26 % less often than the yearly averagereported 18 % less often than the yearly averagereported 21 % less often than the yearly averagereported 26 % less often than the yearly averagereported 20 % less often than the yearly average
much less oftenless oftenno clear differencemore oftenmuch more often

In the USA in April: reported 30 % more often than the yearly average. This is the strongest month there.

Who is reported in the same cells

In how many of 10 areas of this species the other species was reported as well. Counted are the 8,224 cells in which this species is reported regularly; compared with the other species that have a page.

Latest reports on the map

The map shows every cell with reports of this species, including the latest ones, and every other species as well.

View the Canada Goose on the map