Wildpulse Map
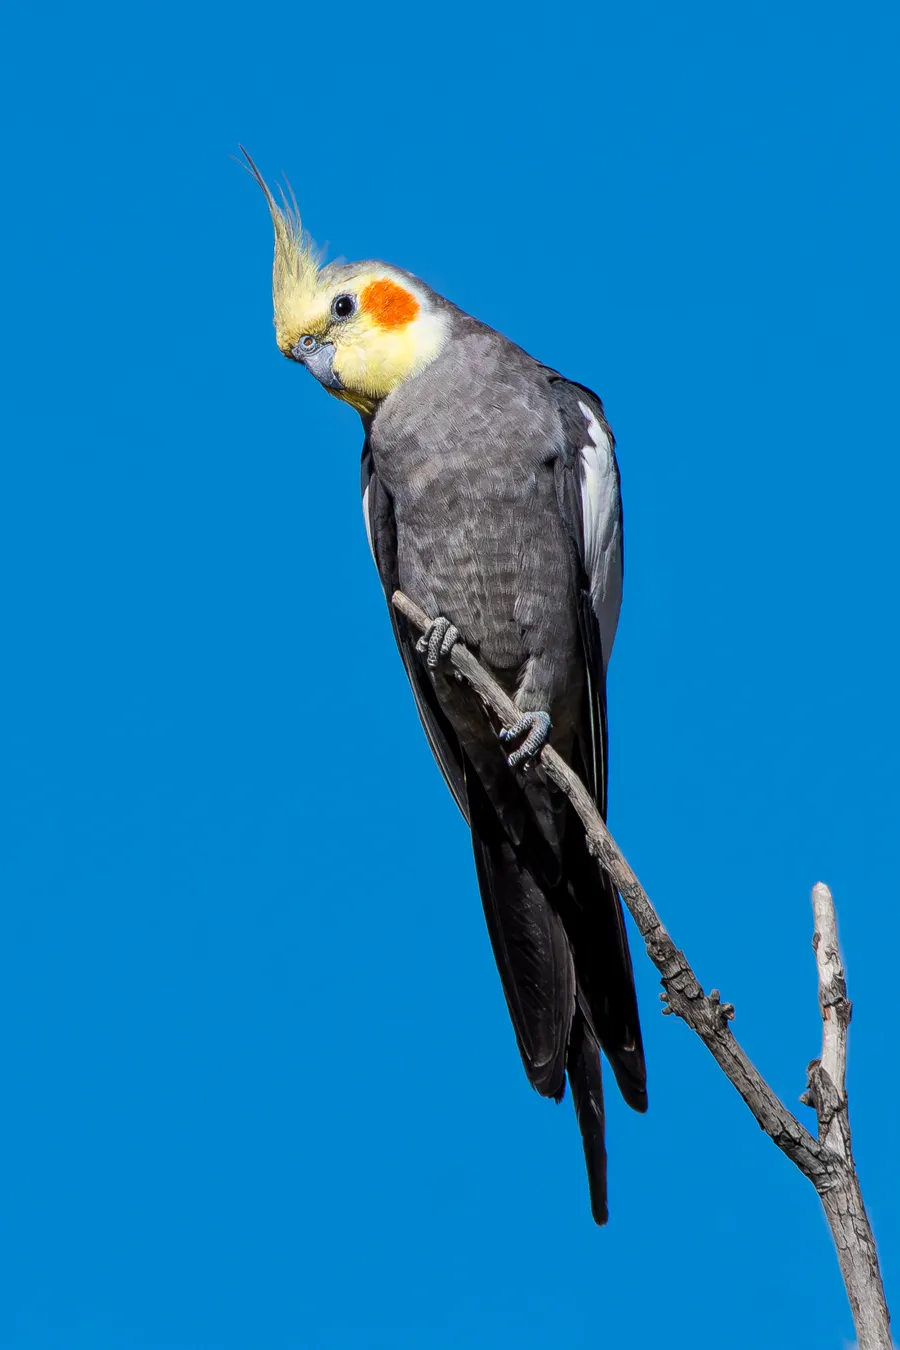
Photo: Cockatiel

Cockatiel

Nymphicus hollandicus

The cockatiel is a small, slender parrot that belongs to the cockatoo family. It is easy to recognise by its crest and the orange cheek patch on its mostly grey plumage with white wing markings. In the wild it lives in the dry interior of Australia, where it feeds mainly on the ground, especially on grass seeds. It is one of the most popular pet birds worldwide.

In our data the species was reported on 38,744 days in 74 countries, most often in Australia, the USA and France.

Last reported on November 14, 2026 in the USA (Texas)

View on the map

Photo: Photo by: Ganatron – paulweberphoto.com, CC BY-SA 4.0

Where the species lives and is reported

Drag to turn the globe

Where it is reported

Most reports come from Oceania (93 %) and from Europe (4 %).

Counted are reporting days: days on which the species was reported at least once in a cell.

Where it was reported

Each hexagon is a cell about 40 km across in which people reported the species. The darker, the more days.

  • 38,744reporting days
  • 2,807cells
  • 74countries

Where it stays pale, few reports come in. That does not mean the species is absent there. The latest reports pulse:

  • Texas, USA
  • South Australia, Australia
  • New South Wales, Australia
  • Victoria, Australia

Where it is reported most often

For each country, the place where the species was reported on the most days. Tap a place.

This is no promise. It shows where people report it especially often.

Through the year

The species is most likely to be reported in September (62 % more often than the yearly average), least often in February (50 % less often). The bars show the difference from the yearly average, adjusted for the fact that more people are outdoors in summer. On the map, a cell is darker the more of its reports fall in the month shown.

January: 44 % less often than the yearly average.

When is the species reported where?

Green means: in this month the species is reported there clearly more often than in the rest of the year. Blue means: clearly less often. We have adjusted for the fact that more people are outdoors in summer. Tap a square.

How often the species is reported per country and month, compared with the yearly average
CountryJFMAMJJASOND
All countriesreported 44 % less often than the yearly averagereported 50 % less often than the yearly averagereported 29 % less often than the yearly averagereported about as often as the yearly averagereported about as often as the yearly averagereported about as often as the yearly averagereported 20 % more often than the yearly averagereported 39 % more often than the yearly averagereported 62 % more often than the yearly averagereported 44 % more often than the yearly averagereported about as often as the yearly averagereported 34 % less often than the yearly average
Australiareported 40 % less often than the yearly averagereported 43 % less often than the yearly averagereported 19 % less often than the yearly averagereported about as often as the yearly averagereported about as often as the yearly averagereported about as often as the yearly averagereported 11 % more often than the yearly averagereported 26 % more often than the yearly averagereported 40 % more often than the yearly averagereported 25 % more often than the yearly averagereported about as often as the yearly averagereported 31 % less often than the yearly average
USAno clear difference from the yearly averageno clear difference from the yearly averageno clear difference from the yearly averageno clear difference from the yearly averageno clear difference from the yearly averageno clear difference from the yearly averagereported about as often as the yearly averagereported 59 % more often than the yearly averageno clear difference from the yearly averageno clear difference from the yearly averagereported about as often as the yearly averageno clear difference from the yearly average
Francereported 69 % less often than the yearly averageno clear difference from the yearly averageno clear difference from the yearly averageno clear difference from the yearly averageno clear difference from the yearly averageno clear difference from the yearly averageno clear difference from the yearly averagereported 80 % more often than the yearly averagereported 72 % more often than the yearly averageno clear difference from the yearly averageno clear difference from the yearly averagereported 72 % less often than the yearly average
Spainno clear difference from the yearly averageno clear difference from the yearly averageno clear difference from the yearly averageno clear difference from the yearly averagereported about as often as the yearly averagereported about as often as the yearly averageno clear difference from the yearly averageno clear difference from the yearly averageno clear difference from the yearly averagereported about as often as the yearly averageno clear difference from the yearly averageno clear difference from the yearly average
Portugalno clear difference from the yearly averageno clear difference from the yearly averageno clear difference from the yearly averageno clear difference from the yearly averageno clear difference from the yearly averageno clear difference from the yearly averageno clear difference from the yearly averagereported 2 times as often as the yearly averageno clear difference from the yearly averagereported about as often as the yearly averagereported about as often as the yearly averageno clear difference from the yearly average
Germanyno clear difference from the yearly averageno clear difference from the yearly averageno clear difference from the yearly averageno clear difference from the yearly averagereported 2.9 times as often as the yearly averageno clear difference from the yearly averageno clear difference from the yearly averagereported 2.2 times as often as the yearly averageno clear difference from the yearly averageno clear difference from the yearly averagereported 92 % less often than the yearly averageno clear difference from the yearly average
Belgiumno clear difference from the yearly averageno clear difference from the yearly averageno clear difference from the yearly averageno clear difference from the yearly averagereported about as often as the yearly averageno clear difference from the yearly averageno clear difference from the yearly averagereported 2.1 times as often as the yearly averagereported 90 % more often than the yearly averagereported about as often as the yearly averageno clear difference from the yearly averageno clear difference from the yearly average
Palestineno clear difference from the yearly averageno clear difference from the yearly averageno clear difference from the yearly averageno clear difference from the yearly averageno clear difference from the yearly averageno clear difference from the yearly averageno clear difference from the yearly averageno clear difference from the yearly averageno clear difference from the yearly averagereported 4.4 times as often as the yearly averageno clear difference from the yearly averageno clear difference from the yearly average
much less oftenless oftenno clear differencemore oftenmuch more often

In Australia in September: reported 40 % more often than the yearly average. This is the strongest month there.

Who is reported in the same cells

In how many of 10 areas of this species the other species was reported as well. Counted are the 1,478 cells in which this species is reported regularly; compared with the other species that have a page.

Latest reports on the map

The map shows every cell with reports of this species, including the latest ones, and every other species as well.

View the Cockatiel on the map