Wildpulse Map
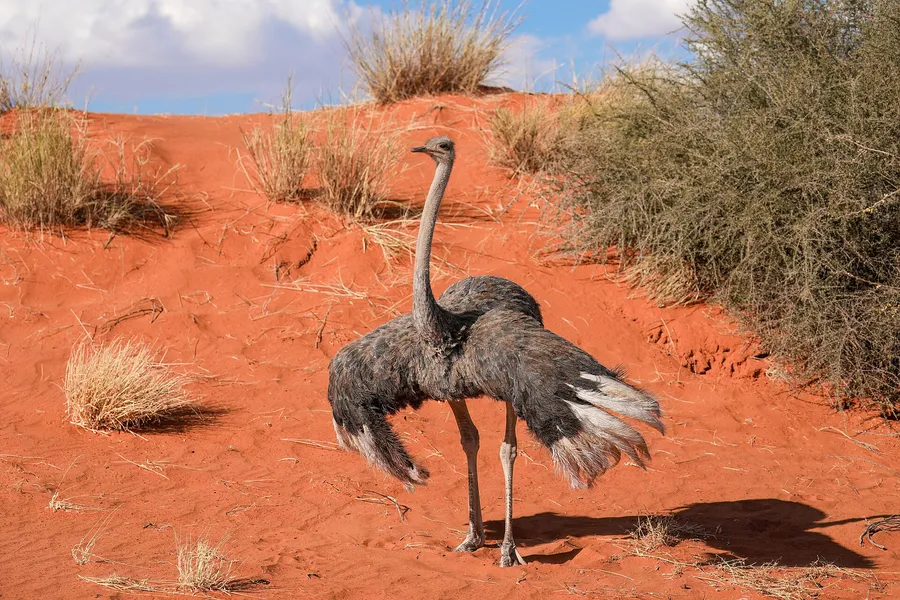
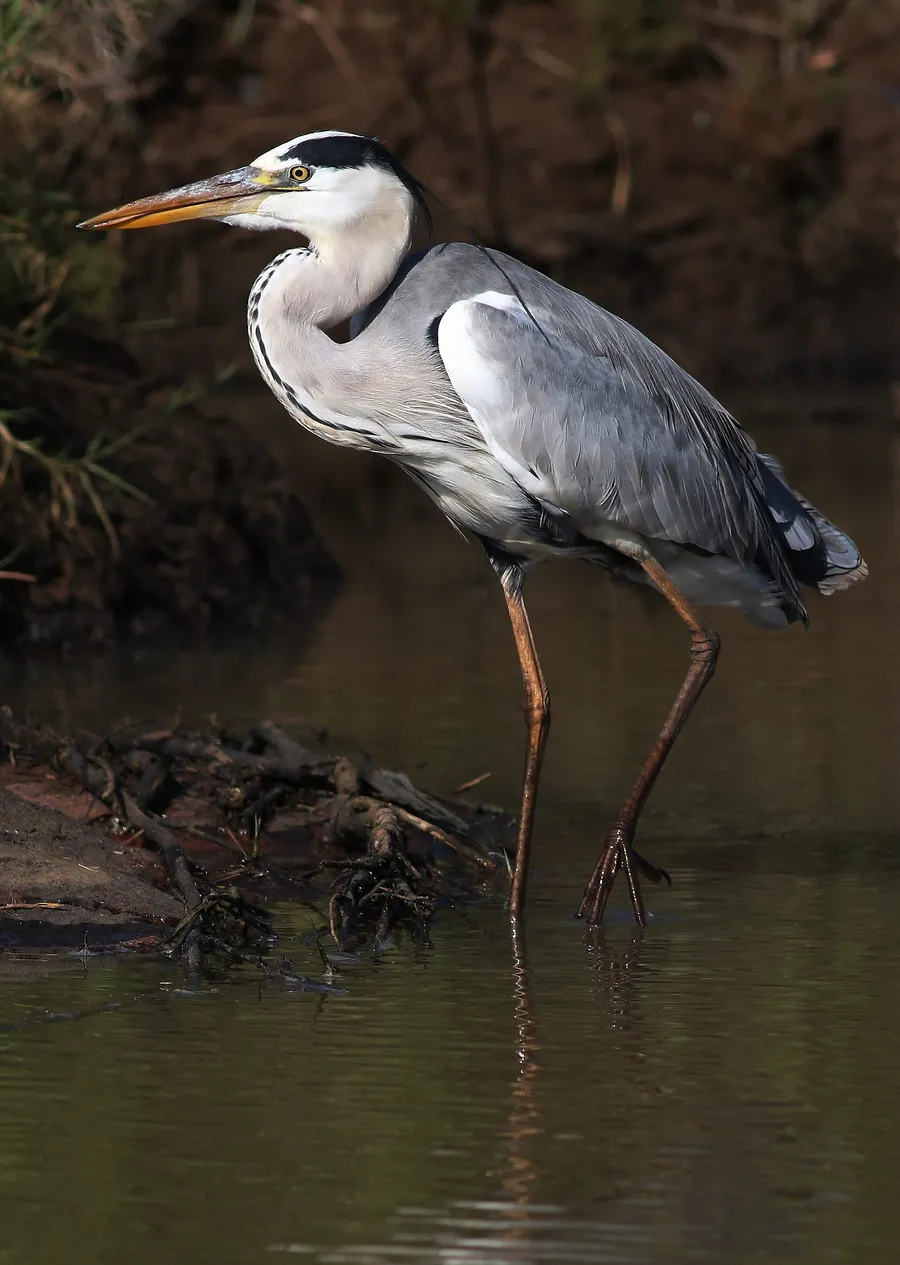
Photo: Common Ostrich

Common Ostrich

Struthio camelus

The common ostrich is the largest living bird. It cannot fly, but it has long, powerful legs with just two toes on each foot. It lives in open country such as savanna and semi-desert in Africa south of the Sahara and eats mainly plants, along with insects and small animals. Sprinting at around 70 km/h, it is the fastest animal on two legs, and no bird alive today produces bigger eggs. Despite the saying, it does not bury its head in the sand.

In our data the species was reported on 79,283 days in 31 countries, most often in South Africa, Namibia and Kenya.

Last reported on November 12, 2026 in South Africa (Limpopo)

View on the map

Photo: Giles Laurent, CC BY-SA 4.0

Where the species lives and is reported

Drag to turn the globe

Where it is reported

Most reports come from Africa (100 %).

Counted are reporting days: days on which the species was reported at least once in a cell.

Where it was reported

Each hexagon is a cell about 40 km across in which people reported the species. The darker, the more days.

  • 79,283reporting days
  • 1,351cells
  • 31countries

Where it stays pale, few reports come in. That does not mean the species is absent there. The latest reports pulse:

  • Limpopo, South Africa
  • Rift Valley, Kenya
  • Gabès, Tunisia
  • Western Cape, South Africa

Where it is reported most often

For each country, the place where the species was reported on the most days. Tap a place.

This is no promise. It shows where people report it especially often.

Through the year

The species is most likely to be reported in September (13 % more often than the yearly average), least often in May (14 % less often). The bars show the difference from the yearly average, adjusted for the fact that more people are outdoors in summer. On the map, a cell is darker the more of its reports fall in the month shown.

January: about as often as the yearly average.

When is the species reported where?

Green means: in this month the species is reported there clearly more often than in the rest of the year. Blue means: clearly less often. We have adjusted for the fact that more people are outdoors in summer. Tap a square.

How often the species is reported per country and month, compared with the yearly average
CountryJFMAMJJASOND
All countriesreported about as often as the yearly averagereported about as often as the yearly averagereported about as often as the yearly averagereported 13 % less often than the yearly averagereported 14 % less often than the yearly averagereported about as often as the yearly averagereported about as often as the yearly averagereported about as often as the yearly averagereported 13 % more often than the yearly averagereported about as often as the yearly averagereported about as often as the yearly averagereported about as often as the yearly average
South Africareported about as often as the yearly averagereported about as often as the yearly averagereported about as often as the yearly averagereported about as often as the yearly averagereported 11 % less often than the yearly averagereported about as often as the yearly averagereported about as often as the yearly averagereported about as often as the yearly averagereported about as often as the yearly averagereported about as often as the yearly averagereported about as often as the yearly averagereported about as often as the yearly average
Namibiareported 19 % less often than the yearly averagereported about as often as the yearly averagereported 18 % less often than the yearly averagereported 17 % less often than the yearly averagereported about as often as the yearly averageno clear difference from the yearly averagereported about as often as the yearly averagereported 15 % more often than the yearly averagereported 17 % more often than the yearly averagereported 12 % more often than the yearly averagereported about as often as the yearly averageno clear difference from the yearly average
Kenyano clear difference from the yearly averageno clear difference from the yearly averageno clear difference from the yearly averagereported 20 % less often than the yearly averagereported about as often as the yearly averagereported 15 % more often than the yearly averagereported 15 % more often than the yearly averagereported 16 % more often than the yearly averageno clear difference from the yearly averagereported about as often as the yearly averagereported about as often as the yearly averagereported about as often as the yearly average
Tanzaniareported 24 % less often than the yearly averagereported about as often as the yearly averagereported 19 % less often than the yearly averageno clear difference from the yearly averagereported 17 % less often than the yearly averagereported 14 % more often than the yearly averagereported 16 % more often than the yearly averagereported 14 % more often than the yearly averagereported about as often as the yearly averageno clear difference from the yearly averagereported about as often as the yearly averageno clear difference from the yearly average
Botswanano clear difference from the yearly averagereported about as often as the yearly averageno clear difference from the yearly averagereported about as often as the yearly averagereported about as often as the yearly averageno clear difference from the yearly averagereported about as often as the yearly averagereported about as often as the yearly averagereported 17 % more often than the yearly averagereported about as often as the yearly averagereported about as often as the yearly averageno clear difference from the yearly average
Mozambiqueno clear difference from the yearly averageno clear difference from the yearly averageno clear difference from the yearly averageno clear difference from the yearly averagereported about as often as the yearly averageno clear difference from the yearly averagereported about as often as the yearly averageno clear difference from the yearly averageno clear difference from the yearly averageno clear difference from the yearly averagereported about as often as the yearly averageno clear difference from the yearly average
Zimbabweno clear difference from the yearly averagereported about as often as the yearly averageno clear difference from the yearly averagereported about as often as the yearly averageno clear difference from the yearly averagereported about as often as the yearly averageno clear difference from the yearly averageno clear difference from the yearly averageno clear difference from the yearly averageno clear difference from the yearly averageno clear difference from the yearly averageno clear difference from the yearly average
Australiano clear difference from the yearly averageno clear difference from the yearly averageno clear difference from the yearly averagereported about as often as the yearly averageno clear difference from the yearly averageno clear difference from the yearly averageno clear difference from the yearly averageno clear difference from the yearly averagereported about as often as the yearly averageno clear difference from the yearly averageno clear difference from the yearly averageno clear difference from the yearly average
much less oftenless oftenno clear differencemore oftenmuch more often

In South Africa in September: reported about as often as the yearly average.

Who is reported in the same cells

In how many of 10 areas of this species the other species was reported as well. Counted are the 940 cells in which this species is reported regularly; compared with the other species that have a page.

Latest reports on the map

The map shows every cell with reports of this species, including the latest ones, and every other species as well.

View the Common Ostrich on the map