Wildpulse Map
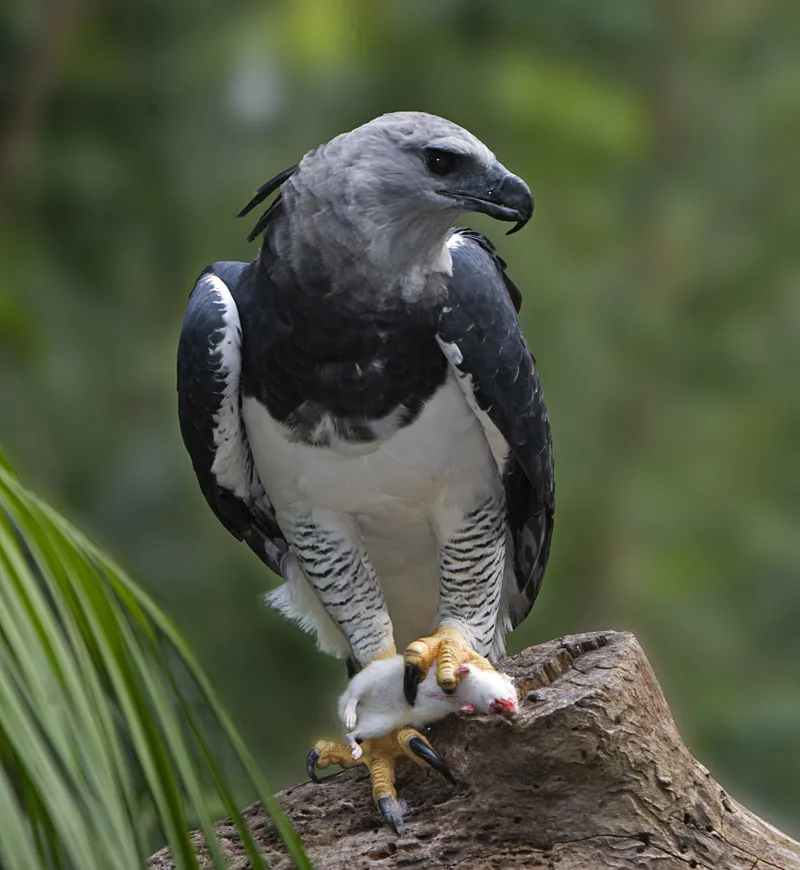
Photo: Harpy Eagle

Harpy Eagle

Harpia harpyja

The harpy eagle is a massive bird of prey and one of the largest eagles on Earth. Its grey head carries a double crest of feathers that it raises when excited. It lives in the tropical rainforests of Central and South America, nesting in giant trees that tower above the canopy. Sloths and monkeys make up most of its prey, snatched from branches with powerful toes; its hind claw can reach about seven centimetres.

In our data the species was reported on 3,446 days in 15 countries, most often in Brazil, Panama and Ecuador.

Last reported on November 5, 2026 in Panama (Darién)

View on the map

Photo: http://www.birdphotos.com, CC BY 3.0

Size and way of life

Wingspan
1.89 mfrom wingtip to wingtip

Where the species lives and is reported

Drag to turn the globe

Where it is reported

Most reports come from South America (74 %), from North America (23 %) and from Europe (3 %).

Counted are reporting days: days on which the species was reported at least once in a cell.

Where it was reported

Each hexagon is a cell about 40 km across in which people reported the species. The darker, the more days.

  • 3,446reporting days
  • 402cells
  • 15countries

Where it stays pale, few reports come in. That does not mean the species is absent there. The latest reports pulse:

  • Darién, Panama
  • Beni, Bolivia
  • Amazonas, Brazil
  • Sucumbíos, Ecuador

Where it is reported most often

For each country, the place where the species was reported on the most days. Tap a place.

This is no promise. It shows where people report it especially often.

Through the year

Across the year there is no clear difference between the months. The bars show the difference from the yearly average, adjusted for the fact that more people are outdoors in summer. On the map, a cell is darker the more of its reports fall in the month shown.

January: 13 % more often than the yearly average.

When is the species reported where?

Green means: in this month the species is reported there clearly more often than in the rest of the year. Blue means: clearly less often. We have adjusted for the fact that more people are outdoors in summer. Tap a square.

How often the species is reported per country and month, compared with the yearly average
CountryJFMAMJJASOND
All countriesno clear difference from the yearly averagereported about as often as the yearly averagereported about as often as the yearly averagereported about as often as the yearly averagereported about as often as the yearly averageno clear difference from the yearly averagereported about as often as the yearly averagereported about as often as the yearly averagereported about as often as the yearly averagereported about as often as the yearly averagereported about as often as the yearly averagereported about as often as the yearly average
Brazilno clear difference from the yearly averagereported 52 % less often than the yearly averagereported about as often as the yearly averageno clear difference from the yearly averagereported about as often as the yearly averagereported about as often as the yearly averageno clear difference from the yearly averageno clear difference from the yearly averagereported about as often as the yearly averageno clear difference from the yearly averageno clear difference from the yearly averagereported about as often as the yearly average
Panamano clear difference from the yearly averageno clear difference from the yearly averageno clear difference from the yearly averagereported about as often as the yearly averageno clear difference from the yearly averageno clear difference from the yearly averageno clear difference from the yearly averageno clear difference from the yearly averagereported about as often as the yearly averageno clear difference from the yearly averageno clear difference from the yearly averagereported about as often as the yearly average
Ecuadorreported about as often as the yearly averageno clear difference from the yearly averagereported about as often as the yearly averageno clear difference from the yearly averagereported about as often as the yearly averageno clear difference from the yearly averagereported about as often as the yearly averageno clear difference from the yearly averageno clear difference from the yearly averageno clear difference from the yearly averagereported about as often as the yearly averagereported about as often as the yearly average
Peruno clear difference from the yearly averageno clear difference from the yearly averageno clear difference from the yearly averagereported about as often as the yearly averagereported 58 % more often than the yearly averageno clear difference from the yearly averageno clear difference from the yearly averageno clear difference from the yearly averagereported about as often as the yearly averagereported 46 % more often than the yearly averageno clear difference from the yearly averageno clear difference from the yearly average
Colombiano clear difference from the yearly averagereported about as often as the yearly averageno clear difference from the yearly averagereported about as often as the yearly averageno clear difference from the yearly averagereported about as often as the yearly averagereported about as often as the yearly averageno clear difference from the yearly averageno clear difference from the yearly averageno clear difference from the yearly averageno clear difference from the yearly averagereported about as often as the yearly average
Guyanareported about as often as the yearly averageno clear difference from the yearly averageno clear difference from the yearly averageno clear difference from the yearly averageno clear difference from the yearly averagereported about as often as the yearly averageno clear difference from the yearly averageno clear difference from the yearly averagereported about as often as the yearly averageno clear difference from the yearly averageno clear difference from the yearly averageno clear difference from the yearly average
Franceno clear difference from the yearly averagereported about as often as the yearly averageno clear difference from the yearly averageno clear difference from the yearly averageno clear difference from the yearly averageno clear difference from the yearly averageno clear difference from the yearly averageno clear difference from the yearly averageno clear difference from the yearly averageno clear difference from the yearly averagereported about as often as the yearly averageno clear difference from the yearly average
Surinameno clear difference from the yearly averagereported about as often as the yearly averageno clear difference from the yearly averagereported about as often as the yearly averageno clear difference from the yearly averagereported about as often as the yearly averageno clear difference from the yearly averageno clear difference from the yearly averagereported about as often as the yearly averageno clear difference from the yearly averageno clear difference from the yearly averageno clear difference from the yearly average
much less oftenless oftenno clear differencemore oftenmuch more often

In Brazil in July: no clear difference from the yearly average. There are too few reports there to tell.

Who is reported in the same cells

In how many of 10 areas of this species the other species was reported as well. Counted are the 148 cells in which this species is reported regularly; compared with the other species that have a page.

Latest reports on the map

The map shows every cell with reports of this species, including the latest ones, and every other species as well.

View the Harpy Eagle on the map