Wildpulse Map
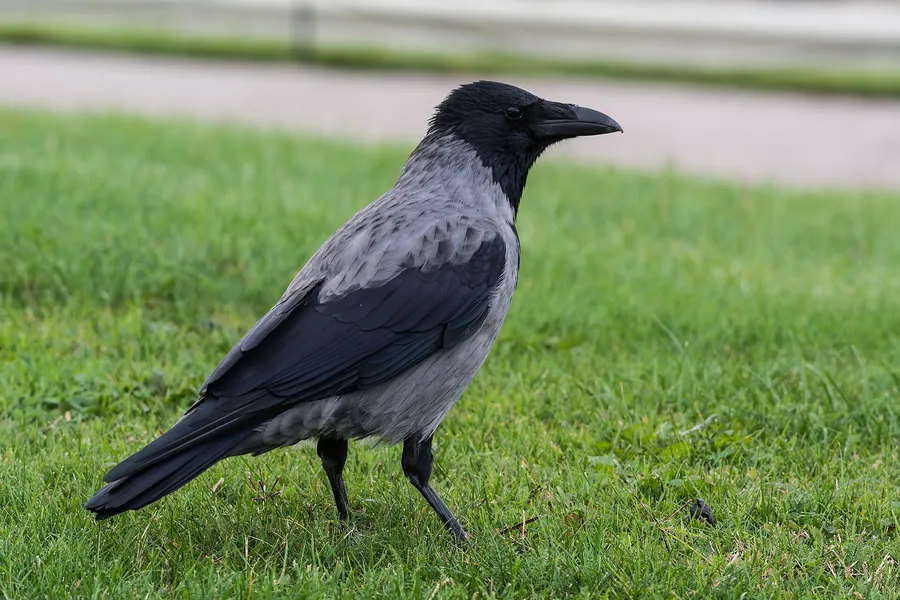
Photo: Hooded Crow

Hooded Crow

Corvus cornix

The hooded crow is a member of the crow family with an ash-grey body set off by a black head, wings and tail. It lives in open country and towns across northern, eastern and southeastern Europe and parts of the Middle East. It eats almost anything, from worms, eggs and mice to berries, seeds, carrion and rubbish, and in towns it often raids bins. Where its range meets that of the all-black carrion crow, the two regularly interbreed in a narrow hybrid zone.

In our data the species was reported on 964,899 days in 67 countries, most often in Norway, Italy and Sweden.

Last reported on November 22, 2026 in Ukraine (Kyiv)

View on the map

Photo: Isiwal, CC BY-SA 4.0

Size and way of life

Wingspan
98 cmfrom wingtip to wingtip

Where the species lives and is reported

Drag to turn the globe

Where it is reported

Most reports come from Europe (88 %) and from Asia (12 %).

Counted are reporting days: days on which the species was reported at least once in a cell.

Where it was reported

Each hexagon is a cell about 40 km across in which people reported the species. The darker, the more days.

  • 964,899reporting days
  • 5,895cells
  • 67countries

Where it stays pale, few reports come in. That does not mean the species is absent there. The latest reports pulse:

  • Kyiv, Ukraine
  • Omsk, Russia
  • Leningrad, Russia
  • Elazığ, Turkey

Where it is reported most often

For each country, the place where the species was reported on the most days. Tap a place.

This is no promise. It shows where people report it especially often.

Through the year

The species is most likely to be reported in October (13 % more often than the yearly average), least often in July (19 % less often). The bars show the difference from the yearly average, adjusted for the fact that more people are outdoors in summer. On the map, a cell is darker the more of its reports fall in the month shown.

January: about as often as the yearly average.

When is the species reported where?

Green means: in this month the species is reported there clearly more often than in the rest of the year. Blue means: clearly less often. We have adjusted for the fact that more people are outdoors in summer. Tap a square.

How often the species is reported per country and month, compared with the yearly average
CountryJFMAMJJASOND
All countriesreported about as often as the yearly averagereported about as often as the yearly averagereported about as often as the yearly averagereported 11 % more often than the yearly averagereported about as often as the yearly averagereported 12 % less often than the yearly averagereported 19 % less often than the yearly averagereported 13 % less often than the yearly averagereported about as often as the yearly averagereported 13 % more often than the yearly averagereported about as often as the yearly averagereported about as often as the yearly average
Norwayreported 24 % more often than the yearly averagereported 12 % more often than the yearly averagereported 18 % more often than the yearly averagereported about as often as the yearly averagereported about as often as the yearly averagereported 19 % less often than the yearly averagereported 25 % less often than the yearly averagereported 19 % less often than the yearly averagereported about as often as the yearly averagereported 11 % more often than the yearly averagereported 13 % more often than the yearly averagereported 12 % more often than the yearly average
Italyreported about as often as the yearly averagereported about as often as the yearly averagereported 11 % more often than the yearly averagereported about as often as the yearly averagereported about as often as the yearly averagereported 11 % less often than the yearly averagereported 22 % less often than the yearly averagereported 28 % less often than the yearly averagereported about as often as the yearly averagereported 13 % more often than the yearly averagereported 15 % more often than the yearly averagereported 18 % more often than the yearly average
Swedenreported 14 % less often than the yearly averagereported 12 % less often than the yearly averagereported about as often as the yearly averagereported about as often as the yearly averagereported 20 % more often than the yearly averagereported about as often as the yearly averagereported about as often as the yearly averagereported about as often as the yearly averagereported about as often as the yearly averagereported about as often as the yearly averagereported about as often as the yearly averagereported 14 % less often than the yearly average
Finlandreported 24 % less often than the yearly averagereported 21 % less often than the yearly averagereported about as often as the yearly averagereported about as often as the yearly averagereported 11 % more often than the yearly averagereported 28 % less often than the yearly averagereported about as often as the yearly averagereported 46 % more often than the yearly averagereported 78 % more often than the yearly averagereported 41 % more often than the yearly averagereported 27 % less often than the yearly averagereported 18 % less often than the yearly average
Turkeyreported 21 % more often than the yearly averagereported 13 % more often than the yearly averagereported 12 % more often than the yearly averagereported about as often as the yearly averagereported about as often as the yearly averagereported 14 % less often than the yearly averagereported 23 % less often than the yearly averagereported 25 % less often than the yearly averagereported 14 % less often than the yearly averagereported about as often as the yearly averagereported 16 % more often than the yearly averagereported 18 % more often than the yearly average
Polandreported about as often as the yearly averagereported about as often as the yearly averagereported 13 % more often than the yearly averagereported about as often as the yearly averagereported about as often as the yearly averagereported 12 % less often than the yearly averagereported 22 % less often than the yearly averagereported 30 % less often than the yearly averagereported about as often as the yearly averagereported 16 % more often than the yearly averagereported 19 % more often than the yearly averagereported 15 % more often than the yearly average
United Kingdomreported 23 % less often than the yearly averagereported 24 % less often than the yearly averagereported 19 % less often than the yearly averagereported about as often as the yearly averagereported 28 % more often than the yearly averagereported 15 % more often than the yearly averagereported about as often as the yearly averagereported about as often as the yearly averagereported 22 % more often than the yearly averagereported 19 % more often than the yearly averagereported 22 % less often than the yearly averagereported 25 % less often than the yearly average
Russiareported about as often as the yearly averagereported 17 % more often than the yearly averagereported 19 % more often than the yearly averagereported about as often as the yearly averagereported about as often as the yearly averagereported 13 % less often than the yearly averagereported 26 % less often than the yearly averagereported 21 % less often than the yearly averagereported about as often as the yearly averagereported 29 % more often than the yearly averagereported 25 % more often than the yearly averagereported 27 % more often than the yearly average
much less oftenless oftenno clear differencemore oftenmuch more often

In Norway in January: reported 24 % more often than the yearly average. This is the strongest month there.

Who is reported in the same cells

In how many of 10 areas of this species the other species was reported as well. Counted are the 4,576 cells in which this species is reported regularly; compared with the other species that have a page.

Latest reports on the map

The map shows every cell with reports of this species, including the latest ones, and every other species as well.

View the Hooded Crow on the map