Where the species is at home
Tinted green are the 6 countries where the species occurs according to the scientific literature.
Country list: Mammal Diversity Database.
 Wildpulse Map
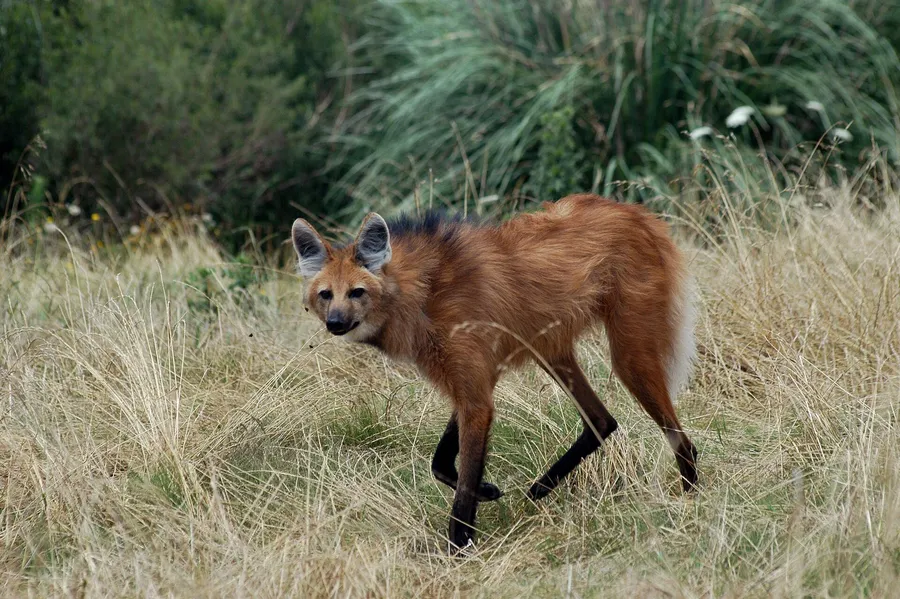
Chrysocyon brachyurus
The maned wolf is the largest wild canid in South America and the tallest of all wild canids; its reddish coat recalls a red fox, set off by very long black legs and a dark mane on its neck. Despite its name and fox-like colouring, it is not closely related to either foxes or wolves. It lives alone in tall grassland and scrub savanna, such as Brazil's Cerrado. It hunts rodents, rabbits, birds and insects, but also eats a lot of fruit, especially the wolf apple, whose seeds it spreads.
In our data the species was reported on 720 days in 4 countries, most often in Brazil, Argentina and Paraguay.
Last reported on November 2, 2026 in Argentina (Santa Fe)
Photo: Aguará, CC BY-SA 3.0
The area of each dot matches the weight.
On average 21 km². The circle shows this area at the same scale as the city. Choose a city or tap the picture to move the circle.
Toronto is as big as 31 home ranges.
Toronto: 662 km². Home range: 21 km², as a circle 5.2 km across. One square in the grid is 10 km wide.
The species does not necessarily live in these cities; the comparison only shows the size. 21 km² is an average from the scientific literature (COMBINE). Real home ranges are not round and can be much smaller or larger depending on the region.
Tinted green are the 6 countries where the species occurs according to the scientific literature.
Country list: Mammal Diversity Database.
Each hexagon is a cell about 40 km across in which people reported the species. The darker, the more days.
Where it stays pale, few reports come in. That does not mean the species is absent there. The latest reports pulse:
For each country, the place where the species was reported on the most days. Tap a place.
This is no promise. It shows where people report it especially often.
Across the year there is no clear difference between the months. The bars show the difference from the yearly average, adjusted for the fact that more people are outdoors in summer. On the map, a cell is darker the more of its reports fall in the month shown.
January: 15 % less often than the yearly average.
Green means: in this month the species is reported there clearly more often than in the rest of the year. Blue means: clearly less often. We have adjusted for the fact that more people are outdoors in summer. Tap a square.
| J | F | M | A | M | J | J | A | S | O | N | D | |
|---|---|---|---|---|---|---|---|---|---|---|---|---|
| All countries | ||||||||||||
| Brazil | ||||||||||||
| Argentina |
In Brazil in September: no clear difference from the yearly average. There are too few reports there to tell.
In how many of 10 areas of this species the other species was reported as well. Counted are the 59 cells in which this species is reported regularly; compared with the other species that have a page.
The map shows every cell with reports of this species, including the latest ones, and every other species as well.
View the Maned Wolf on the map