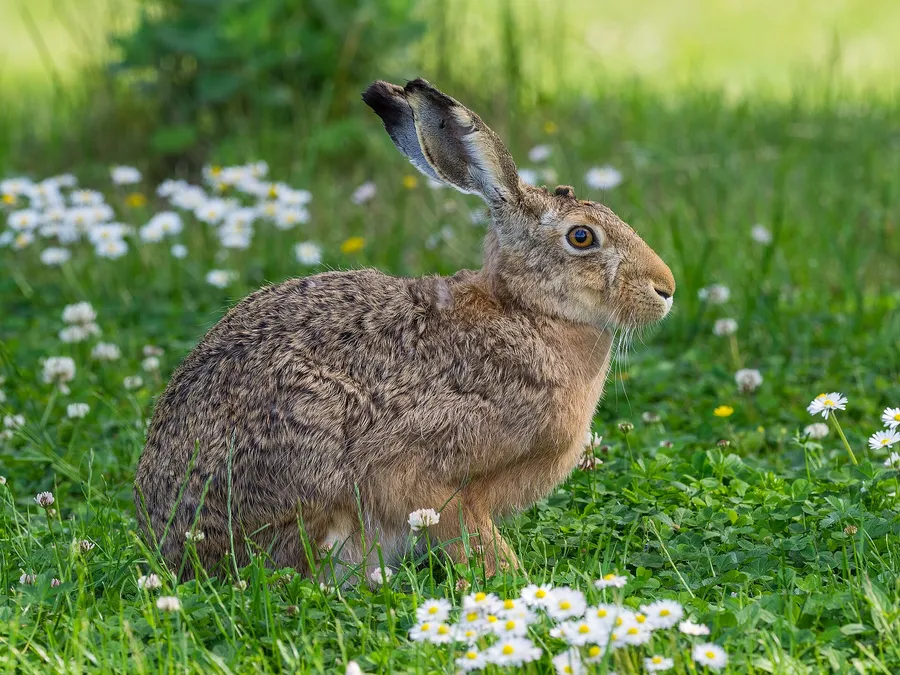
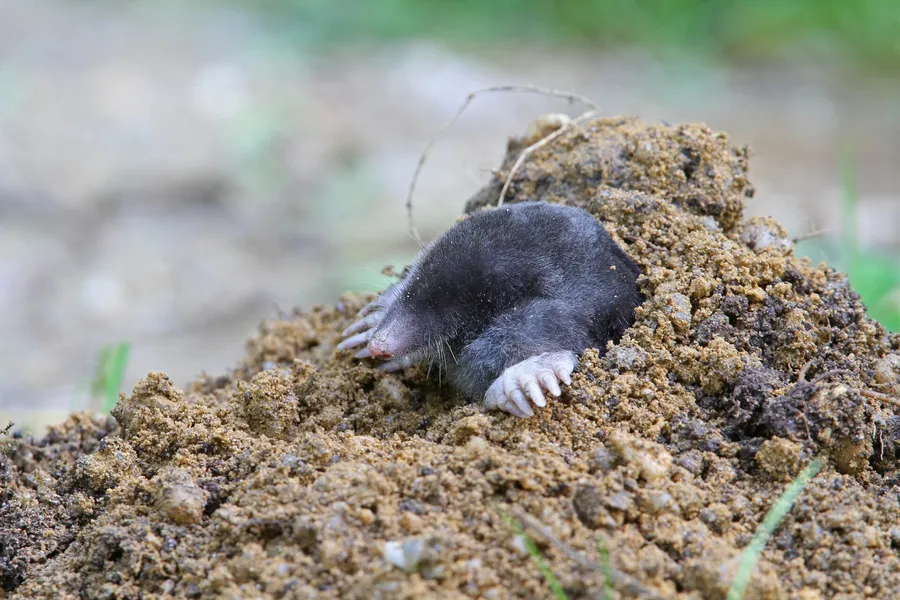
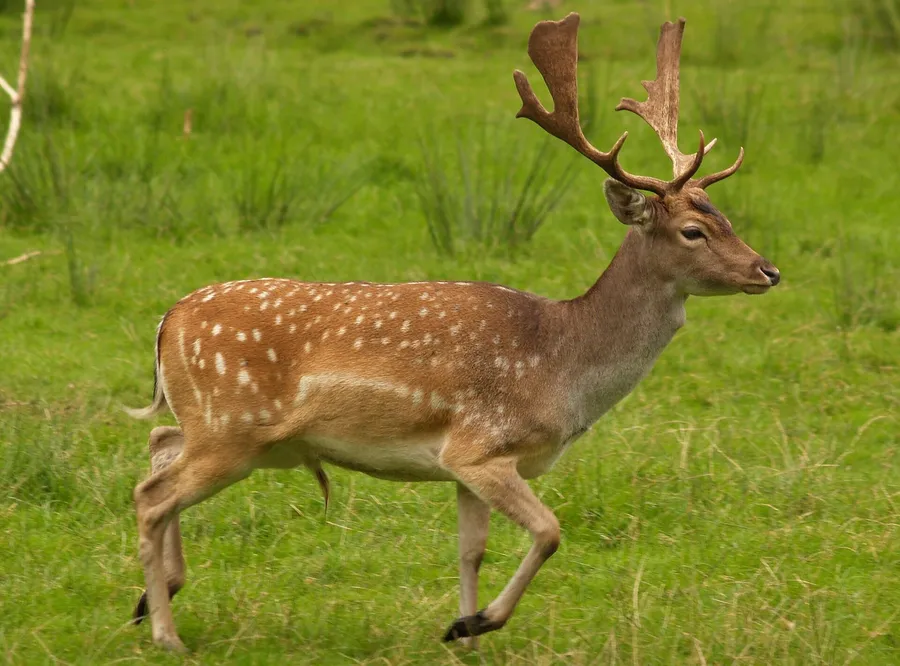
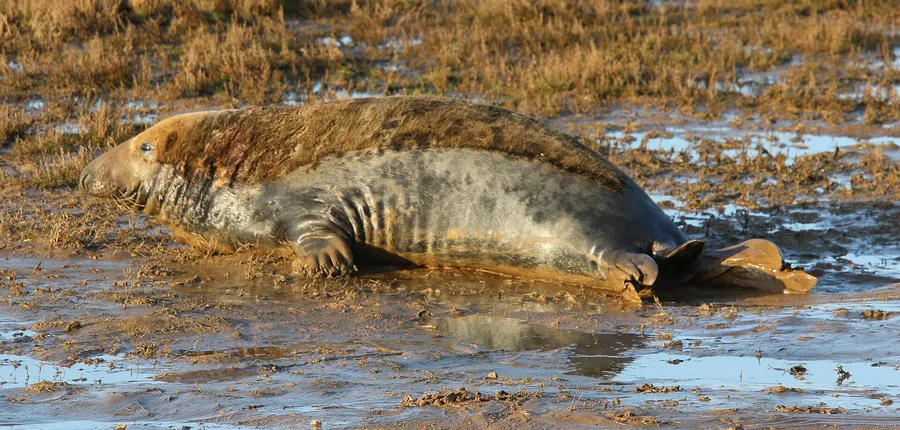
| All countries | reported about as often as the yearly average | reported about as often as the yearly average | reported 30 % more often than the yearly average | reported 55 % more often than the yearly average | reported 56 % more often than the yearly average | reported 22 % more often than the yearly average | reported about as often as the yearly average | reported 26 % less often than the yearly average | reported 46 % less often than the yearly average | reported 47 % less often than the yearly average | reported 48 % less often than the yearly average | reported 32 % less often than the yearly average |
|---|
| France | reported about as often as the yearly average | reported about as often as the yearly average | reported 24 % more often than the yearly average | reported 37 % more often than the yearly average | reported 56 % more often than the yearly average | reported 26 % more often than the yearly average | reported about as often as the yearly average | reported 30 % less often than the yearly average | reported 43 % less often than the yearly average | reported 51 % less often than the yearly average | reported 42 % less often than the yearly average | reported 25 % less often than the yearly average |
|---|
| Germany | reported 33 % less often than the yearly average | reported about as often as the yearly average | reported 41 % more often than the yearly average | reported 63 % more often than the yearly average | reported 64 % more often than the yearly average | reported 47 % more often than the yearly average | reported 22 % more often than the yearly average | reported 15 % less often than the yearly average | reported 59 % less often than the yearly average | reported 66 % less often than the yearly average | reported 67 % less often than the yearly average | reported 56 % less often than the yearly average |
|---|
| Denmark | reported 15 % less often than the yearly average | reported about as often as the yearly average | reported 35 % more often than the yearly average | reported 72 % more often than the yearly average | reported 53 % more often than the yearly average | reported 26 % more often than the yearly average | reported 14 % more often than the yearly average | reported 21 % less often than the yearly average | reported 36 % less often than the yearly average | reported 55 % less often than the yearly average | reported 61 % less often than the yearly average | reported 55 % less often than the yearly average |
|---|
| United Kingdom | reported 24 % less often than the yearly average | reported about as often as the yearly average | reported 47 % more often than the yearly average | reported 2 times as often as the yearly average | reported 74 % more often than the yearly average | reported about as often as the yearly average | reported about as often as the yearly average | reported 18 % less often than the yearly average | reported 42 % less often than the yearly average | reported 40 % less often than the yearly average | reported 49 % less often than the yearly average | reported 49 % less often than the yearly average |
|---|
| Switzerland | reported 25 % more often than the yearly average | reported 17 % more often than the yearly average | reported 59 % more often than the yearly average | reported 56 % more often than the yearly average | reported 36 % more often than the yearly average | reported 10 % more often than the yearly average | reported 11 % less often than the yearly average | reported 37 % less often than the yearly average | reported 58 % less often than the yearly average | reported 56 % less often than the yearly average | reported 46 % less often than the yearly average | reported about as often as the yearly average |
|---|
| Sweden | reported 24 % more often than the yearly average | reported 11 % more often than the yearly average | reported 26 % more often than the yearly average | reported 71 % more often than the yearly average | reported 53 % more often than the yearly average | reported about as often as the yearly average | reported 29 % less often than the yearly average | reported 43 % less often than the yearly average | reported 48 % less often than the yearly average | reported 53 % less often than the yearly average | reported 49 % less often than the yearly average | reported 33 % less often than the yearly average |
|---|
| Finland | reported 18 % more often than the yearly average | reported 37 % more often than the yearly average | reported about as often as the yearly average | reported 21 % less often than the yearly average | reported 17 % less often than the yearly average | reported 33 % more often than the yearly average | reported 52 % less often than the yearly average | reported 52 % less often than the yearly average | reported 73 % less often than the yearly average | reported 2 times as often as the yearly average | reported 27 % less often than the yearly average | reported about as often as the yearly average |
|---|
| Netherlands | reported 79 % less often than the yearly average | reported 65 % less often than the yearly average | reported 64 % less often than the yearly average | reported 33 % more often than the yearly average | reported 64 % more often than the yearly average | reported 60 % more often than the yearly average | reported 48 % more often than the yearly average | reported 22 % more often than the yearly average | reported 15 % more often than the yearly average | reported about as often as the yearly average | reported about as often as the yearly average | reported 54 % less often than the yearly average |
|---|
 Wildpulse Map