Wildpulse Map
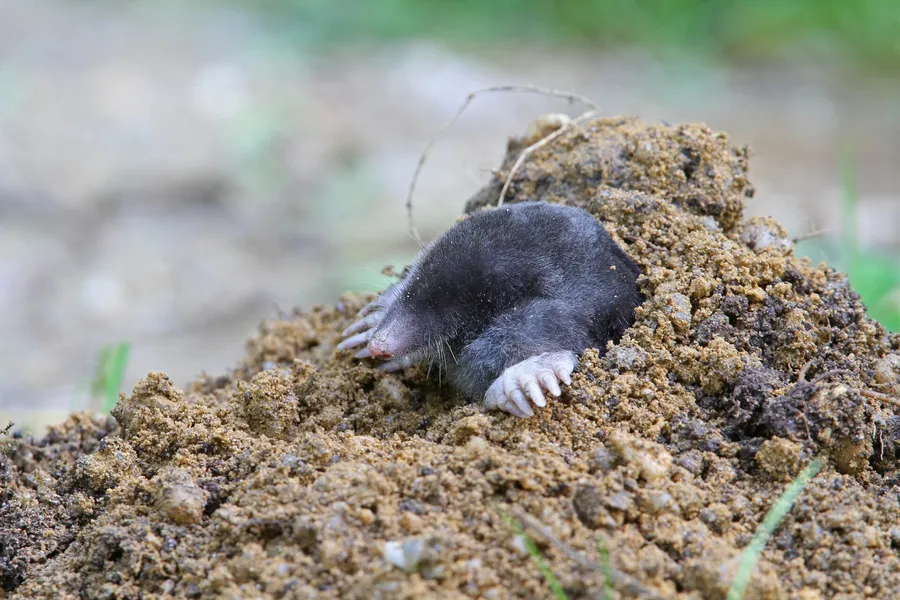
Photo: European Mole

European Mole

Talpa europaea

The European mole lives almost entirely underground in a tunnel system it keeps extending. It pushes the loose soil up to the surface, which creates molehills. It eats mainly earthworms, but also insects and larvae. Its saliva contains substances that paralyse earthworms, so it can keep them alive in a store. Its eyes are tiny, and it finds its way by touch with its snout.

In our data the species was reported on 49,814 days in 34 countries, most often in France, the United Kingdom and Germany.

Last reported on November 21, 2026 in the United Kingdom (Warwickshire)

View on the map

Photo: Christoph Moning, CC BY 4.0

Size and way of life

Weight
110 gaverage for adults
Length
15 cmhead and body, without tail
Home range
0.002 km²average size of the area an animal lives in
Young
4 youngper litter, after a gestation of 31 days
Active
variesat night, at dusk or also by day
Altitude
up to 2,400 mabove sea level
Maximum age
7 yearsoldest recorded age

From birth to old age

  1. 3.3 gat birth
  2. 48 gat 35 days, when the young are weaned
  3. 110 gfully grown; able to breed at 11 months
  4. 7 yearsoldest recorded age

The area of each dot matches the weight.

Where the species lives and is reported

Drag to turn the globe
Country where it occurs

Where the species is at home

Tinted green are the 36 countries where the species occurs according to the scientific literature.

Country list: Mammal Diversity Database.

Where it was reported

Each hexagon is a cell about 40 km across in which people reported the species. The darker, the more days.

  • 49,814reporting days
  • 1,560cells
  • 34countries

Where it stays pale, few reports come in. That does not mean the species is absent there. The latest reports pulse:

  • Warwickshire, United Kingdom
  • East Ayrshire, United Kingdom
  • Chelyabinsk, Russia
  • Croydon, United Kingdom

Where it is reported most often

For each country, the place where the species was reported on the most days. Tap a place.

This is no promise. It shows where people report it especially often.

Through the year

The species is most likely to be reported in January (51 % more often than the yearly average), least often in October (28 % less often). The bars show the difference from the yearly average, adjusted for the fact that more people are outdoors in summer. On the map, a cell is darker the more of its reports fall in the month shown.

January: 51 % more often than the yearly average.

When is the species reported where?

Green means: in this month the species is reported there clearly more often than in the rest of the year. Blue means: clearly less often. We have adjusted for the fact that more people are outdoors in summer. Tap a square.

How often the species is reported per country and month, compared with the yearly average
CountryJFMAMJJASOND
All countriesreported 51 % more often than the yearly averagereported 27 % more often than the yearly averagereported about as often as the yearly averagereported about as often as the yearly averagereported about as often as the yearly averagereported 13 % less often than the yearly averagereported about as often as the yearly averagereported 26 % less often than the yearly averagereported 10 % more often than the yearly averagereported 28 % less often than the yearly averagereported 17 % less often than the yearly averagereported about as often as the yearly average
Francereported 71 % more often than the yearly averagereported about as often as the yearly averagereported about as often as the yearly averagereported about as often as the yearly averagereported about as often as the yearly averagereported about as often as the yearly averagereported 13 % less often than the yearly averagereported 21 % less often than the yearly averagereported 22 % less often than the yearly averagereported 26 % less often than the yearly averagereported 17 % less often than the yearly averagereported about as often as the yearly average
United Kingdomreported 56 % more often than the yearly averagereported 67 % more often than the yearly averagereported 58 % more often than the yearly averagereported 29 % more often than the yearly averagereported about as often as the yearly averagereported 43 % less often than the yearly averagereported 40 % less often than the yearly averagereported 41 % less often than the yearly averagereported 32 % less often than the yearly averagereported 18 % less often than the yearly averagereported about as often as the yearly averagereported 33 % more often than the yearly average
Germanyreported 40 % more often than the yearly averagereported 14 % more often than the yearly averagereported 21 % less often than the yearly averagereported 52 % less often than the yearly averagereported 33 % more often than the yearly averagereported 12 % less often than the yearly averagereported 23 % less often than the yearly averagereported 44 % less often than the yearly averagereported 2.2 times as often as the yearly averagereported 42 % less often than the yearly averagereported 40 % less often than the yearly averagereported 16 % more often than the yearly average
Switzerlandno clear difference from the yearly averagereported 35 % less often than the yearly averagereported 37 % less often than the yearly averagereported 50 % less often than the yearly averagereported 48 % less often than the yearly averagereported 35 % more often than the yearly averagereported 2.6 times as often as the yearly averagereported 51 % more often than the yearly averagereported about as often as the yearly averagereported about as often as the yearly averagereported 35 % less often than the yearly averagereported 59 % less often than the yearly average
Denmarkreported 2.2 times as often as the yearly averagereported 41 % less often than the yearly averageno clear difference from the yearly averagereported about as often as the yearly averagereported 38 % less often than the yearly averageno clear difference from the yearly averagereported 2.2 times as often as the yearly averagereported 32 % more often than the yearly averagereported about as often as the yearly averagereported 47 % less often than the yearly averagereported 52 % less often than the yearly averagereported 69 % less often than the yearly average
Belgiumreported 47 % more often than the yearly averagereported 86 % more often than the yearly averagereported 42 % more often than the yearly averageno clear difference from the yearly averagereported 37 % less often than the yearly averagereported about as often as the yearly averageno clear difference from the yearly averageno clear difference from the yearly averagereported 44 % less often than the yearly averageno clear difference from the yearly averageno clear difference from the yearly averagereported about as often as the yearly average
Netherlandsno clear difference from the yearly averagereported 89 % more often than the yearly averagereported 41 % more often than the yearly averageno clear difference from the yearly averageno clear difference from the yearly averagereported about as often as the yearly averageno clear difference from the yearly averageno clear difference from the yearly averagereported about as often as the yearly averagereported 51 % less often than the yearly averagereported 54 % less often than the yearly averageno clear difference from the yearly average
Swedenreported 65 % less often than the yearly averagereported 53 % less often than the yearly averagereported 51 % less often than the yearly averageno clear difference from the yearly averageno clear difference from the yearly averageno clear difference from the yearly averagereported 2.8 times as often as the yearly averagereported 79 % more often than the yearly averagereported about as often as the yearly averageno clear difference from the yearly averageno clear difference from the yearly averagereported 67 % less often than the yearly average
much less oftenless oftenno clear differencemore oftenmuch more often

In France in January: reported 71 % more often than the yearly average. This is the strongest month there.

Who is reported in the same cells

In how many of 10 areas of this species the other species was reported as well. Counted are the 1,142 cells in which this species is reported regularly; compared with the other species that have a page.

Latest reports on the map

The map shows every cell with reports of this species, including the latest ones, and every other species as well.

View the European Mole on the map