Wildpulse Map
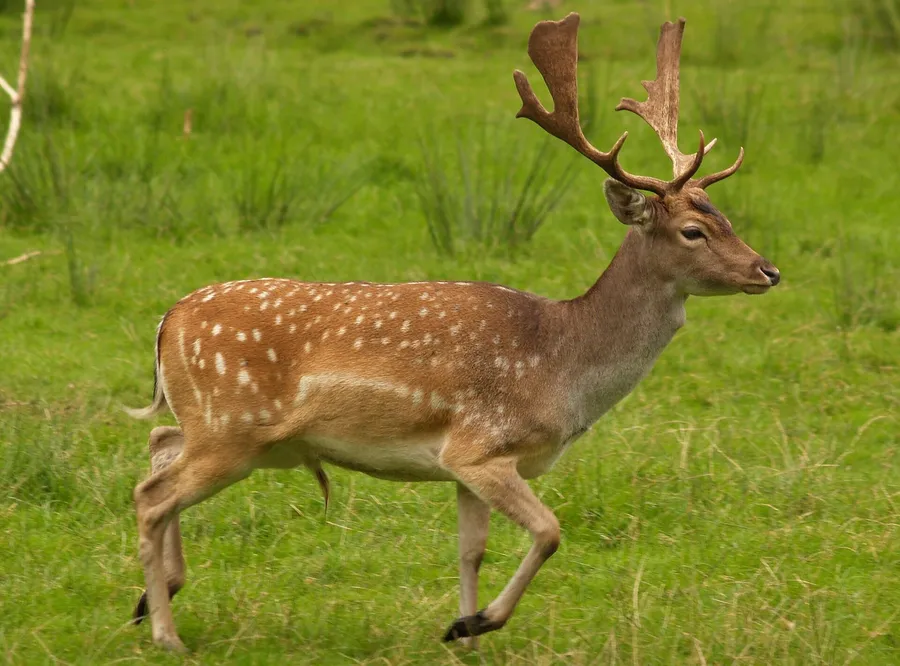
Photo: European Fallow Deer

European Fallow Deer

Dama dama

The fallow deer has a pale-spotted reddish-brown summer coat, and males carry antlers with broad palmate tips. It originates from Turkey and the Mediterranean area and was brought back by people to much of Europe. It lives in herds in open woodland and parks. The rut takes place in autumn, when males fight over females. Grass, herbs and leaves make up its diet.

In our data the species was reported on 42,507 days in 35 countries, most often in the United Kingdom, Sweden and Germany.

Last reported on November 21, 2026 in the United Kingdom (Croydon)

View on the map

Photo: Johann-Nikolaus Andreae, CC BY-SA 2.0

Size and way of life

Weight
64 kgaverage for adults
Length
1.75 mhead and body, without tail
Home range
0.7 km²average size of the area an animal lives in
Young
1.1 youngper litter, after a gestation of 8 months
Active
variesat night, at dusk or also by day
Maximum age
25 yearsoldest recorded age

From birth to old age

  1. 4.5 kgat birth
  2. 23 kgat 6 months, when the young are weaned
  3. 64 kgfully grown; able to breed at 18 months
  4. 25 yearsoldest recorded age

The area of each dot matches the weight.

Where the species lives and is reported

Drag to turn the globe
Country where it occurs

Where the species is at home

Tinted green are the 39 countries where the species occurs according to the scientific literature.

Country list: Mammal Diversity Database.

Where it was reported

Each hexagon is a cell about 40 km across in which people reported the species. The darker, the more days.

  • 42,507reporting days
  • 1,162cells
  • 35countries

Where it stays pale, few reports come in. That does not mean the species is absent there. The latest reports pulse:

  • Croydon, United Kingdom
  • Derbyshire, United Kingdom
  • Havering, United Kingdom
  • Kent, United Kingdom

Where it is reported most often

For each country, the place where the species was reported on the most days. Tap a place.

This is no promise. It shows where people report it especially often.

Through the year

The species is most likely to be reported in November (48 % more often than the yearly average), least often in July (30 % less often). The bars show the difference from the yearly average, adjusted for the fact that more people are outdoors in summer. On the map, a cell is darker the more of its reports fall in the month shown.

January: 28 % more often than the yearly average.

When is the species reported where?

Green means: in this month the species is reported there clearly more often than in the rest of the year. Blue means: clearly less often. We have adjusted for the fact that more people are outdoors in summer. Tap a square.

How often the species is reported per country and month, compared with the yearly average
CountryJFMAMJJASOND
All countriesreported 28 % more often than the yearly averagereported about as often as the yearly averagereported about as often as the yearly averagereported 14 % more often than the yearly averagereported about as often as the yearly averagereported 24 % less often than the yearly averagereported 30 % less often than the yearly averagereported 30 % less often than the yearly averagereported 25 % less often than the yearly averagereported 33 % more often than the yearly averagereported 48 % more often than the yearly averagereported 18 % more often than the yearly average
United Kingdomreported 26 % more often than the yearly averagereported 14 % more often than the yearly averagereported 17 % more often than the yearly averagereported 23 % more often than the yearly averagereported about as often as the yearly averagereported 35 % less often than the yearly averagereported 29 % less often than the yearly averagereported 33 % less often than the yearly averagereported 17 % less often than the yearly averagereported 32 % more often than the yearly averagereported 38 % more often than the yearly averagereported 13 % more often than the yearly average
Swedenreported 36 % more often than the yearly averagereported 38 % more often than the yearly averagereported 46 % more often than the yearly averagereported 32 % more often than the yearly averagereported about as often as the yearly averagereported 22 % less often than the yearly averagereported 44 % less often than the yearly averagereported 48 % less often than the yearly averagereported 35 % less often than the yearly averagereported about as often as the yearly averagereported 45 % more often than the yearly averagereported about as often as the yearly average
Germanyreported 22 % more often than the yearly averagereported about as often as the yearly averagereported 27 % less often than the yearly averagereported 20 % less often than the yearly averagereported 28 % less often than the yearly averagereported 29 % less often than the yearly averagereported 27 % less often than the yearly averagereported 20 % less often than the yearly averagereported 26 % less often than the yearly averagereported 79 % more often than the yearly averagereported 2 times as often as the yearly averagereported 39 % more often than the yearly average
Australiareported 35 % less often than the yearly averagereported 39 % less often than the yearly averageno clear difference from the yearly averagereported 79 % more often than the yearly averagereported 29 % more often than the yearly averageno clear difference from the yearly averagereported about as often as the yearly averageno clear difference from the yearly averagereported 17 % less often than the yearly averagereported about as often as the yearly averageno clear difference from the yearly averagereported about as often as the yearly average
Denmarkreported 60 % more often than the yearly averagereported about as often as the yearly averageno clear difference from the yearly averagereported 21 % less often than the yearly averagereported 44 % less often than the yearly averagereported 42 % less often than the yearly averagereported 52 % less often than the yearly averagereported 48 % less often than the yearly averagereported about as often as the yearly averagereported 73 % more often than the yearly averagereported 2.1 times as often as the yearly averagereported 73 % more often than the yearly average
Francereported 3.9 times as often as the yearly averageno clear difference from the yearly averageno clear difference from the yearly averageno clear difference from the yearly averageno clear difference from the yearly averagereported 46 % less often than the yearly averagereported 43 % less often than the yearly averagereported 48 % less often than the yearly averagereported 53 % less often than the yearly averagereported 35 % more often than the yearly averageno clear difference from the yearly averagereported about as often as the yearly average
Belgiumreported 46 % less often than the yearly averageno clear difference from the yearly averagereported 31 % less often than the yearly averagereported about as often as the yearly averagereported 30 % more often than the yearly averagereported about as often as the yearly averageno clear difference from the yearly averageno clear difference from the yearly averageno clear difference from the yearly averagereported about as often as the yearly averagereported 85 % more often than the yearly averageno clear difference from the yearly average
Spainno clear difference from the yearly averageno clear difference from the yearly averageno clear difference from the yearly averageno clear difference from the yearly averageno clear difference from the yearly averageno clear difference from the yearly averageno clear difference from the yearly averagereported 60 % more often than the yearly averageno clear difference from the yearly averageno clear difference from the yearly averagereported about as often as the yearly averageno clear difference from the yearly average
much less oftenless oftenno clear differencemore oftenmuch more often

In the United Kingdom in November: reported 38 % more often than the yearly average. This is the strongest month there.

Who is reported in the same cells

In how many of 10 areas of this species the other species was reported as well. Counted are the 753 cells in which this species is reported regularly; compared with the other species that have a page.

Latest reports on the map

The map shows every cell with reports of this species, including the latest ones, and every other species as well.

View the European Fallow Deer on the map