Wildpulse Map
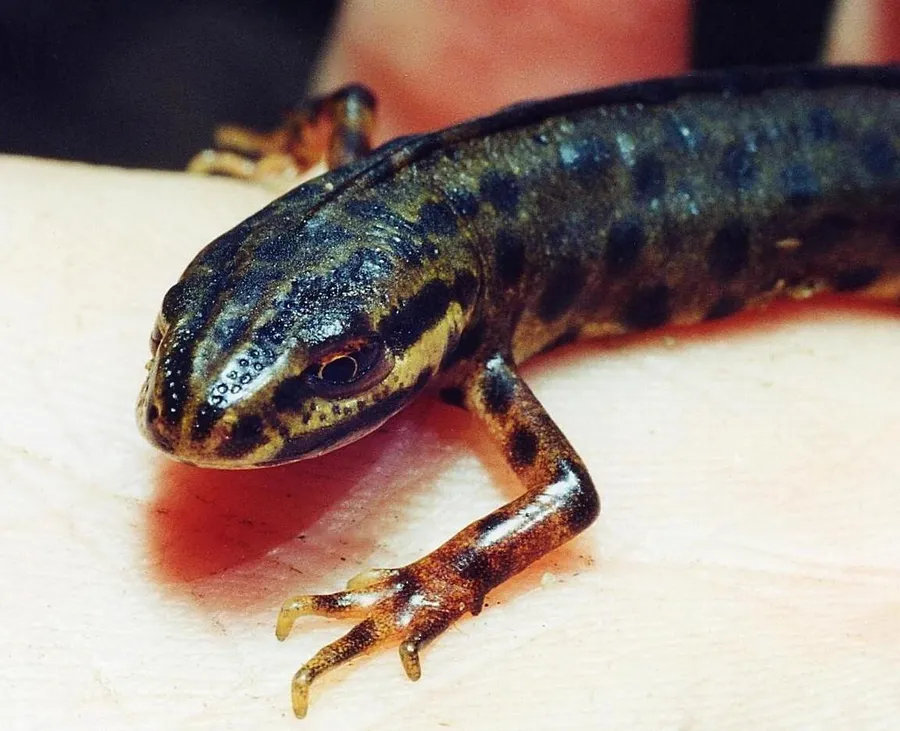
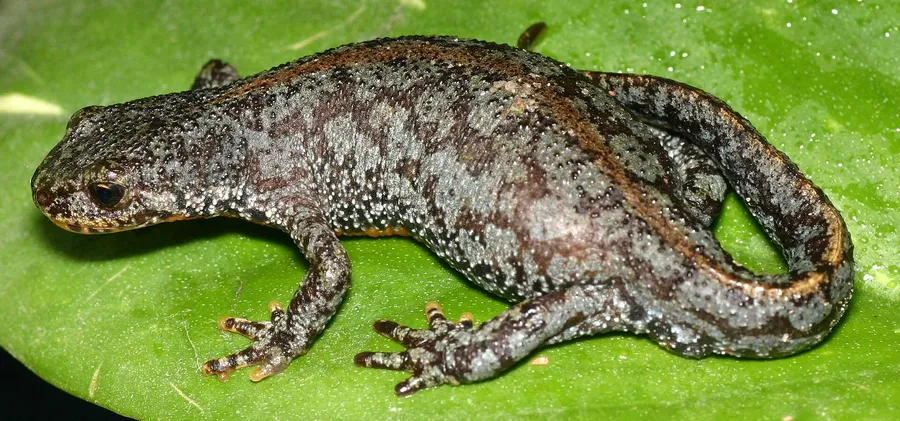
Photo: Smooth Newt

Smooth Newt

Lissotriton vulgaris

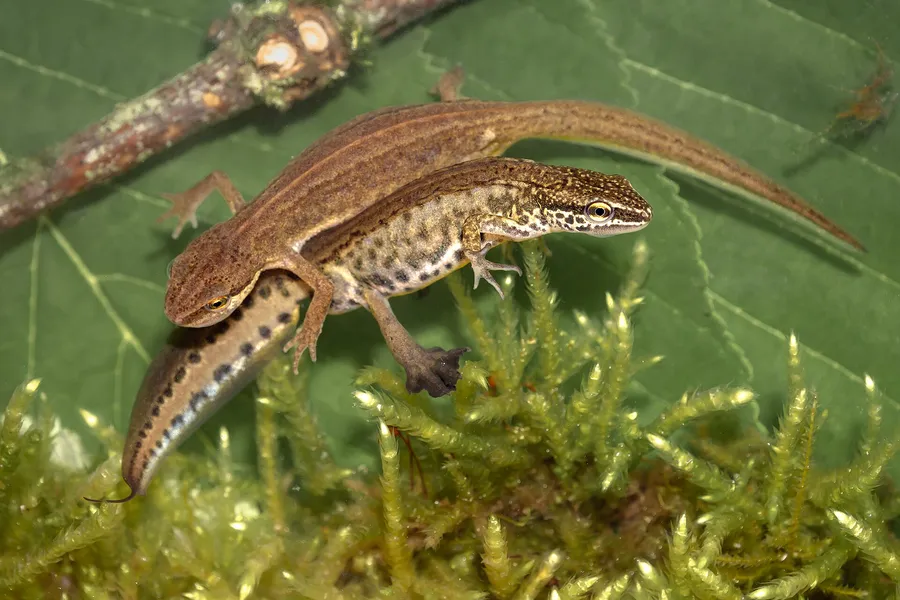
The smooth newt is a small newt, at most about eleven centimetres long, with an orange belly marked with dark spots. In the breeding season, males grow a tall, wavy crest along the back and tail. It is found across most of Europe and parts of western Asia, spending spring in ponds and the rest of the year hidden on land. It eats insects, worms, small crustaceans and tadpoles. Females fold each egg individually into the leaf of a water plant.

In our data the species was reported on 50,064 days in 33 countries, most often in Sweden, the United Kingdom and Denmark.

Last reported on November 20, 2026 in the United Kingdom (Suffolk)

View on the map

Photo: Christian Fischer, CC BY-SA 3.0

Where the species lives and is reported

Drag to turn the globe

Where it is reported

Most reports come from Europe (100 %).

Counted are reporting days: days on which the species was reported at least once in a cell.

Where it was reported

Each hexagon is a cell about 40 km across in which people reported the species. The darker, the more days.

  • 50,064reporting days
  • 1,553cells
  • 33countries

Where it stays pale, few reports come in. That does not mean the species is absent there. The latest reports pulse:

  • Suffolk, United Kingdom
  • Warmian-Masurian Voivodeship, Poland
  • Galway, Ireland
  • Lower Austria, Austria

Where it is reported most often

For each country, the place where the species was reported on the most days. Tap a place.

This is no promise. It shows where people report it especially often.

Through the year

The species is most likely to be reported in April (34 % more often than the yearly average), least often in November (42 % less often). The bars show the difference from the yearly average, adjusted for the fact that more people are outdoors in summer. On the map, a cell is darker the more of its reports fall in the month shown.

January: 24 % more often than the yearly average.

When is the species reported where?

Green means: in this month the species is reported there clearly more often than in the rest of the year. Blue means: clearly less often. We have adjusted for the fact that more people are outdoors in summer. Tap a square.

How often the species is reported per country and month, compared with the yearly average
CountryJFMAMJJASOND
All countriesreported 24 % more often than the yearly averagereported about as often as the yearly averagereported 15 % more often than the yearly averagereported 34 % more often than the yearly averagereported 24 % more often than the yearly averagereported about as often as the yearly averagereported 29 % less often than the yearly averagereported 39 % less often than the yearly averagereported 39 % less often than the yearly averagereported 38 % less often than the yearly averagereported 42 % less often than the yearly averagereported 40 % less often than the yearly average
Swedenno clear difference from the yearly averageno clear difference from the yearly averagereported 48 % more often than the yearly averagereported 20 % more often than the yearly averagereported 50 % more often than the yearly averagereported 14 % less often than the yearly averagereported 53 % less often than the yearly averagereported 44 % less often than the yearly averagereported 44 % less often than the yearly averagereported 28 % less often than the yearly averageno clear difference from the yearly averagereported 66 % less often than the yearly average
United Kingdomreported 2 times as often as the yearly averagereported 20 % more often than the yearly averagereported about as often as the yearly averagereported 35 % more often than the yearly averagereported 16 % more often than the yearly averagereported 10 % less often than the yearly averagereported 36 % less often than the yearly averagereported 45 % less often than the yearly averagereported 38 % less often than the yearly averagereported about as often as the yearly averagereported about as often as the yearly averageno clear difference from the yearly average
Denmarkreported 77 % less often than the yearly averagereported 86 % more often than the yearly averagereported 24 % more often than the yearly averagereported 28 % more often than the yearly averagereported 14 % less often than the yearly averagereported about as often as the yearly averagereported 12 % more often than the yearly averagereported 16 % less often than the yearly averagereported 15 % less often than the yearly averageno clear difference from the yearly averageno clear difference from the yearly averageno clear difference from the yearly average
Germanyno clear difference from the yearly averagereported 81 % more often than the yearly averagereported 63 % more often than the yearly averagereported 42 % more often than the yearly averagereported about as often as the yearly averagereported 16 % less often than the yearly averagereported 40 % less often than the yearly averagereported 58 % less often than the yearly averagereported 58 % less often than the yearly averagereported 43 % less often than the yearly averagereported 37 % less often than the yearly averageno clear difference from the yearly average
Francereported 81 % more often than the yearly averagereported about as often as the yearly averagereported 34 % more often than the yearly averagereported 53 % more often than the yearly averagereported about as often as the yearly averagereported 30 % less often than the yearly averagereported 63 % less often than the yearly averagereported 85 % less often than the yearly averagereported 65 % less often than the yearly averagereported 52 % less often than the yearly averagereported 68 % less often than the yearly averagereported 68 % less often than the yearly average
Norwayreported 2 times as often as the yearly averageno clear difference from the yearly averagereported 33 % less often than the yearly averagereported 17 % less often than the yearly averagereported 51 % more often than the yearly averagereported 34 % more often than the yearly averagereported 28 % less often than the yearly averagereported 38 % less often than the yearly averagereported 28 % less often than the yearly averageno clear difference from the yearly averageno clear difference from the yearly averageno clear difference from the yearly average
Switzerlandreported 3.5 times as often as the yearly averagereported 2.2 times as often as the yearly averagereported 2.2 times as often as the yearly averagereported 68 % more often than the yearly averagereported about as often as the yearly averagereported 63 % less often than the yearly averagereported 77 % less often than the yearly averagereported 94 % less often than the yearly averagereported 97 % less often than the yearly averagereported 87 % less often than the yearly averagereported 63 % less often than the yearly averagereported 83 % less often than the yearly average
Belgiumreported about as often as the yearly averageno clear difference from the yearly averagereported 47 % more often than the yearly averagereported 78 % more often than the yearly averagereported 27 % more often than the yearly averageno clear difference from the yearly averageno clear difference from the yearly averagereported 70 % less often than the yearly averagereported 81 % less often than the yearly averagereported 76 % less often than the yearly averagereported 64 % less often than the yearly averageno clear difference from the yearly average
much less oftenless oftenno clear differencemore oftenmuch more often

In Sweden in May: reported 50 % more often than the yearly average. This is the strongest month there.

Who is reported in the same cells

In how many of 10 areas of this species the other species was reported as well. Counted are the 1,076 cells in which this species is reported regularly; compared with the other species that have a page.

Latest reports on the map

The map shows every cell with reports of this species, including the latest ones, and every other species as well.

View the Smooth Newt on the map