Wildpulse Map
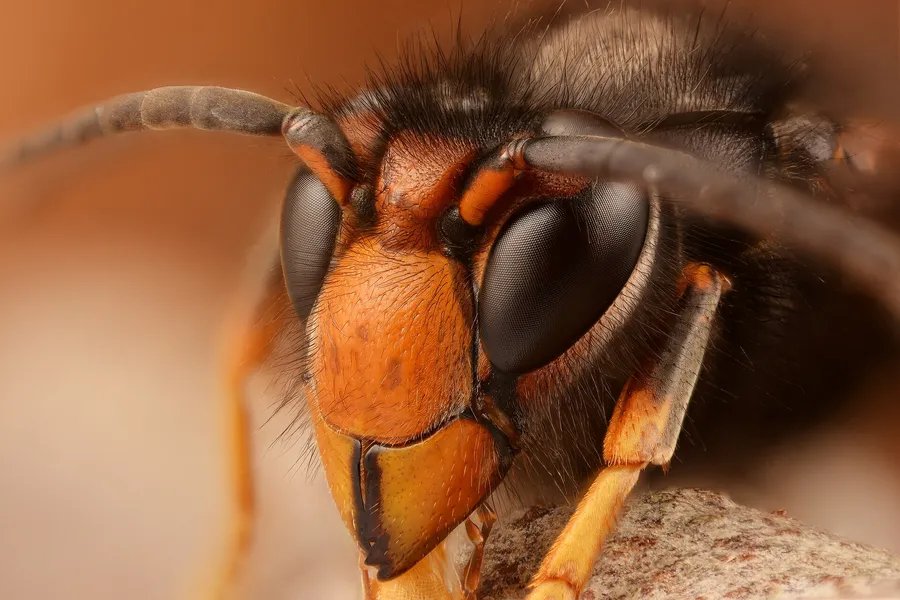
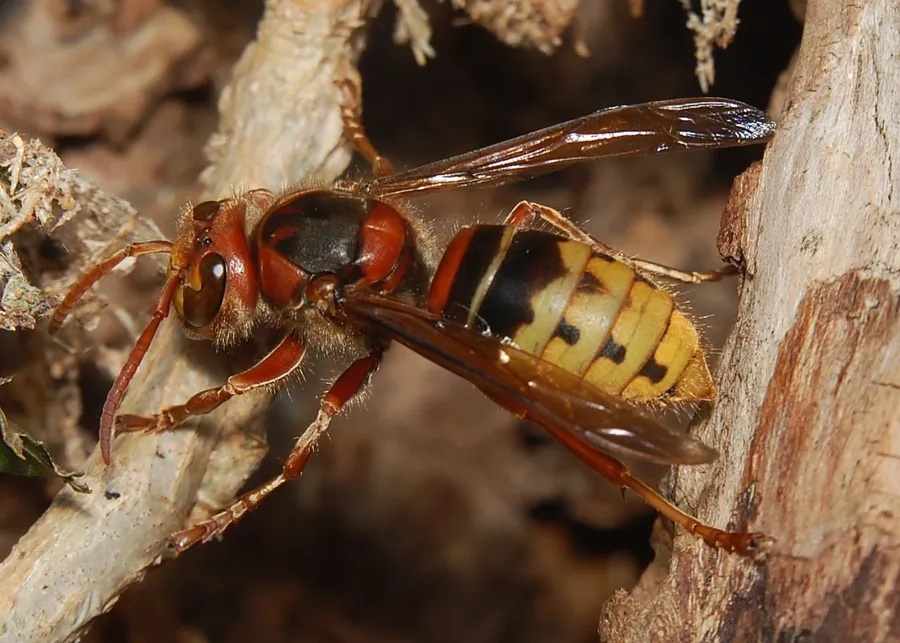
Photo: Asian Hornet

Asian Hornet

Vespa velutina

The Asian hornet, also called the yellow-legged hornet, is a dark hornet from Southeast Asia, slightly smaller than the European hornet, with a black thorax. It was first found in Europe in south-western France in 2004 and has since spread widely. Colonies of several thousand live in large paper nests, usually high in trees. The adults feed on nectar and ripe fruit, but they hunt insects for their larvae. That is what makes it a pest: at apiaries it hovers in front of hives and picks off returning honeybees.

In our data the species was reported on 40,715 days in 27 countries, most often in France, Germany and Belgium.

Last reported on November 21, 2026 in France (Var)

View on the map

Photo: Gilles San Martin from Namur, Belgium, CC BY-SA 2.0

Where the species lives and is reported

Drag to turn the globe

Where it is reported

Most reports come from Europe (99 %).

Counted are reporting days: days on which the species was reported at least once in a cell.

Where it was reported

Each hexagon is a cell about 40 km across in which people reported the species. The darker, the more days.

  • 40,715reporting days
  • 904cells
  • 27countries

Where it stays pale, few reports come in. That does not mean the species is absent there. The latest reports pulse:

  • Var, France
  • Biscay, Spain
  • Hauts-de-Seine, France
  • East Flanders, Belgium

Where it is reported most often

For each country, the place where the species was reported on the most days. Tap a place.

This is no promise. It shows where people report it especially often.

Through the year

The species is most likely to be reported in November (291 % more often than the yearly average), least often in March (72 % less often). The bars show the difference from the yearly average, adjusted for the fact that more people are outdoors in summer. On the map, a cell is darker the more of its reports fall in the month shown.

January: 13 % less often than the yearly average.

When is the species reported where?

Green means: in this month the species is reported there clearly more often than in the rest of the year. Blue means: clearly less often. We have adjusted for the fact that more people are outdoors in summer. Tap a square.

How often the species is reported per country and month, compared with the yearly average
CountryJFMAMJJASOND
All countriesreported 13 % less often than the yearly averagereported 54 % less often than the yearly averagereported 72 % less often than the yearly averagereported 51 % less often than the yearly averagereported 53 % less often than the yearly averagereported 71 % less often than the yearly averagereported 47 % less often than the yearly averagereported 17 % more often than the yearly averagereported 64 % more often than the yearly averagereported 2.4 times as often as the yearly averagereported 3.9 times as often as the yearly averagereported 3.9 times as often as the yearly average
Francereported about as often as the yearly averagereported 48 % less often than the yearly averagereported 71 % less often than the yearly averagereported 60 % less often than the yearly averagereported 69 % less often than the yearly averagereported 80 % less often than the yearly averagereported 51 % less often than the yearly averagereported 14 % more often than the yearly averagereported 65 % more often than the yearly averagereported 2.4 times as often as the yearly averagereported 5.1 times as often as the yearly averagereported 6.3 times as often as the yearly average
Germanyreported 53 % less often than the yearly averagereported 74 % less often than the yearly averagereported 73 % less often than the yearly averagereported 36 % less often than the yearly averagereported 19 % less often than the yearly averagereported 57 % less often than the yearly averagereported 52 % less often than the yearly averagereported 25 % more often than the yearly averagereported 68 % more often than the yearly averagereported 2.5 times as often as the yearly averagereported 3.1 times as often as the yearly averagereported 29 % more often than the yearly average
Belgiumno clear difference from the yearly averagereported 28 % less often than the yearly averagereported 61 % less often than the yearly averagereported 37 % less often than the yearly averagereported 43 % less often than the yearly averagereported 67 % less often than the yearly averagereported 34 % less often than the yearly averagereported 21 % more often than the yearly averagereported 58 % more often than the yearly averagereported 2.2 times as often as the yearly averagereported 2.3 times as often as the yearly averagereported 49 % more often than the yearly average
Switzerlandreported 50 % less often than the yearly averagereported 72 % less often than the yearly averagereported 92 % less often than the yearly averagereported 46 % less often than the yearly averagereported 38 % less often than the yearly averagereported 52 % less often than the yearly averagereported 40 % less often than the yearly averagereported about as often as the yearly averagereported 60 % more often than the yearly averagereported 2.6 times as often as the yearly averagereported 3.3 times as often as the yearly averagereported 73 % more often than the yearly average
Spainno clear difference from the yearly averageno clear difference from the yearly averageno clear difference from the yearly averageno clear difference from the yearly averagereported 67 % less often than the yearly averagereported 83 % less often than the yearly averageno clear difference from the yearly averageno clear difference from the yearly averagereported 68 % more often than the yearly averageno clear difference from the yearly averagereported 2.5 times as often as the yearly averagereported 3.3 times as often as the yearly average
Portugalno clear difference from the yearly averageno clear difference from the yearly averageno clear difference from the yearly averageno clear difference from the yearly averageno clear difference from the yearly averagereported 83 % less often than the yearly averageno clear difference from the yearly averagereported 67 % more often than the yearly averagereported 2.2 times as often as the yearly averageno clear difference from the yearly averageno clear difference from the yearly averageno clear difference from the yearly average
Netherlandsno clear difference from the yearly averageno clear difference from the yearly averageno clear difference from the yearly averagereported 79 % less often than the yearly averagereported 70 % less often than the yearly averagereported 69 % less often than the yearly averageno clear difference from the yearly averageno clear difference from the yearly averageno clear difference from the yearly averagereported 3.5 times as often as the yearly averagereported 3.8 times as often as the yearly averageno clear difference from the yearly average
South Koreano clear difference from the yearly averageno clear difference from the yearly averageno clear difference from the yearly averageno clear difference from the yearly averagereported 83 % less often than the yearly averageno clear difference from the yearly averageno clear difference from the yearly averageno clear difference from the yearly averagereported 2 times as often as the yearly averagereported 3 times as often as the yearly averageno clear difference from the yearly averageno clear difference from the yearly average
much less oftenless oftenno clear differencemore oftenmuch more often

In France in December: reported 6.3 times as often as the yearly average. This is the strongest month there.

Who is reported in the same cells

In how many of 10 areas of this species the other species was reported as well. Counted are the 623 cells in which this species is reported regularly; compared with the other species that have a page.

Latest reports on the map

The map shows every cell with reports of this species, including the latest ones, and every other species as well.

View the Asian Hornet on the map