Wildpulse Map
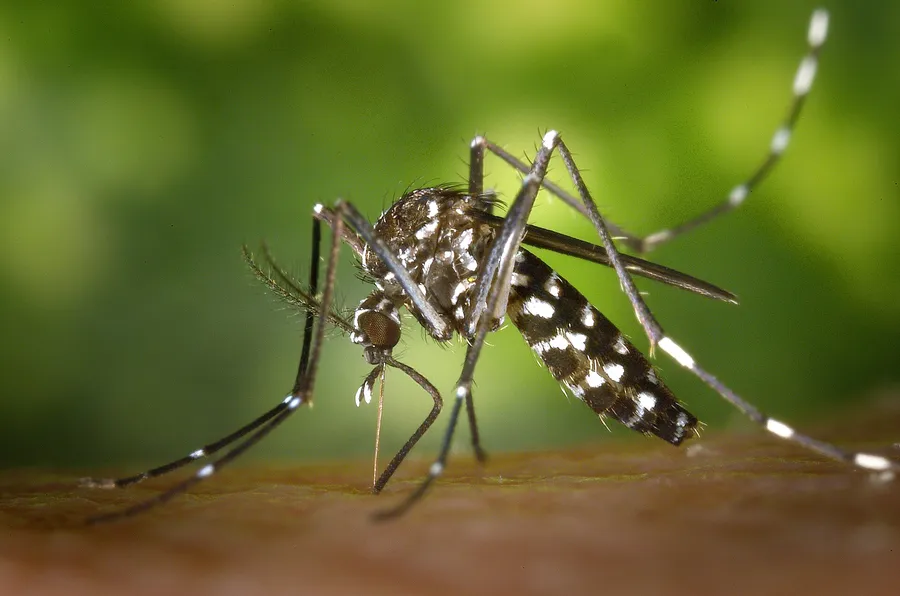
Photo: Asian Tiger Mosquito

Asian Tiger Mosquito

Aedes albopictus

The Asian tiger mosquito is a small mosquito named for the bold white bands on its black body and legs. Originally from Southeast Asia, it has spread to many parts of the world, often carried along in used tyres. Its larvae develop in tiny pools of water, almost any open container will do. Both sexes feed on nectar, but females also take blood, often during the day, and the species can transmit viruses such as dengue and chikungunya.

In our data the species was reported on 20,080 days in 79 countries, most often in Spain, Italy and France.

Last reported on November 22, 2026 in Brazil (Goiás)

View on the map

Photo: James Gathany, CDC, Public domain

Where the species lives and is reported

Drag to turn the globe

Where it is reported

Most reports come from Europe (87 %), from Asia (7 %) and from North America (5 %).

Counted are reporting days: days on which the species was reported at least once in a cell.

Where it was reported

Each hexagon is a cell about 40 km across in which people reported the species. The darker, the more days.

  • 20,080reporting days
  • 1,560cells
  • 79countries

Where it stays pale, few reports come in. That does not mean the species is absent there. The latest reports pulse:

  • Goiás, Brazil
  • Los Santos, Panama
  • Hsinchu, Taiwan
  • Maryland, USA

Where it is reported most often

For each country, the place where the species was reported on the most days. Tap a place.

This is no promise. It shows where people report it especially often.

Through the year

The species is most likely to be reported in September (82 % more often than the yearly average), least often in March (90 % less often). The bars show the difference from the yearly average, adjusted for the fact that more people are outdoors in summer. On the map, a cell is darker the more of its reports fall in the month shown.

January: 66 % less often than the yearly average.

When is the species reported where?

Green means: in this month the species is reported there clearly more often than in the rest of the year. Blue means: clearly less often. We have adjusted for the fact that more people are outdoors in summer. Tap a square.

How often the species is reported per country and month, compared with the yearly average
CountryJFMAMJJASOND
All countriesreported 66 % less often than the yearly averagereported 79 % less often than the yearly averagereported 90 % less often than the yearly averagereported 82 % less often than the yearly averagereported 48 % less often than the yearly averagereported 12 % more often than the yearly averagereported 21 % more often than the yearly averagereported 66 % more often than the yearly averagereported 82 % more often than the yearly averagereported 59 % more often than the yearly averagereported 24 % less often than the yearly averagereported 61 % less often than the yearly average
Spainreported 98 % less often than the yearly averagereported 97 % less often than the yearly averagereported 99 % less often than the yearly averagereported 84 % less often than the yearly averagereported 49 % less often than the yearly averagereported 22 % more often than the yearly averagereported 33 % more often than the yearly averagereported 72 % more often than the yearly averagereported 75 % more often than the yearly averagereported 40 % more often than the yearly averagereported 47 % less often than the yearly averagereported 93 % less often than the yearly average
Italyreported 67 % less often than the yearly averagereported 78 % less often than the yearly averagereported 97 % less often than the yearly averagereported 97 % less often than the yearly averagereported 37 % less often than the yearly averagereported 29 % more often than the yearly averagereported about as often as the yearly averagereported 16 % more often than the yearly averagereported 51 % more often than the yearly averagereported 74 % more often than the yearly averagereported about as often as the yearly averagereported 85 % less often than the yearly average
Franceno clear difference from the yearly averageno clear difference from the yearly averagereported 77 % less often than the yearly averagereported 67 % less often than the yearly averagereported 34 % less often than the yearly averagereported 36 % less often than the yearly averagereported about as often as the yearly averagereported 47 % more often than the yearly averagereported 2 times as often as the yearly averagereported 62 % more often than the yearly averageno clear difference from the yearly averageno clear difference from the yearly average
USAreported 87 % less often than the yearly averagereported 68 % less often than the yearly averagereported 80 % less often than the yearly averagereported 58 % less often than the yearly averageno clear difference from the yearly averagereported about as often as the yearly averagereported 31 % more often than the yearly averagereported 63 % more often than the yearly averagereported 61 % more often than the yearly averagereported about as often as the yearly averagereported 41 % less often than the yearly averagereported 74 % less often than the yearly average
Thailandno clear difference from the yearly averagereported 48 % less often than the yearly averagereported 38 % less often than the yearly averagereported 48 % less often than the yearly averageno clear difference from the yearly averagereported 54 % more often than the yearly averagereported about as often as the yearly averageno clear difference from the yearly averageno clear difference from the yearly averageno clear difference from the yearly averageno clear difference from the yearly averagereported about as often as the yearly average
Hungaryno clear difference from the yearly averageno reportsno reportsreported 98 % less often than the yearly averagereported 77 % less often than the yearly averageno clear difference from the yearly averageno clear difference from the yearly averagereported 2.4 times as often as the yearly averagereported 2.8 times as often as the yearly averagereported about as often as the yearly averagereported 74 % less often than the yearly averageno clear difference from the yearly average
Austriano clear difference from the yearly averageno clear difference from the yearly averagereported 95 % less often than the yearly averageno reportsreported 84 % less often than the yearly averagereported 53 % less often than the yearly averageno clear difference from the yearly averagereported 2 times as often as the yearly averagereported 2.7 times as often as the yearly averagereported 2.1 times as often as the yearly averageno clear difference from the yearly averageno clear difference from the yearly average
Croatiano clear difference from the yearly averageno clear difference from the yearly averageno clear difference from the yearly averageno clear difference from the yearly averagereported 77 % less often than the yearly averageno clear difference from the yearly averageno clear difference from the yearly averagereported 2.2 times as often as the yearly averagereported 2.9 times as often as the yearly averageno clear difference from the yearly averageno clear difference from the yearly averageno clear difference from the yearly average
much less oftenless oftenno clear differencemore oftenmuch more often

In Spain in September: reported 75 % more often than the yearly average. This is the strongest month there.

Who is reported in the same cells

In how many of 10 areas of this species the other species was reported as well. Counted are the 691 cells in which this species is reported regularly; compared with the other species that have a page.

Latest reports on the map

The map shows every cell with reports of this species, including the latest ones, and every other species as well.

View the Asian Tiger Mosquito on the map