Wildpulse Map
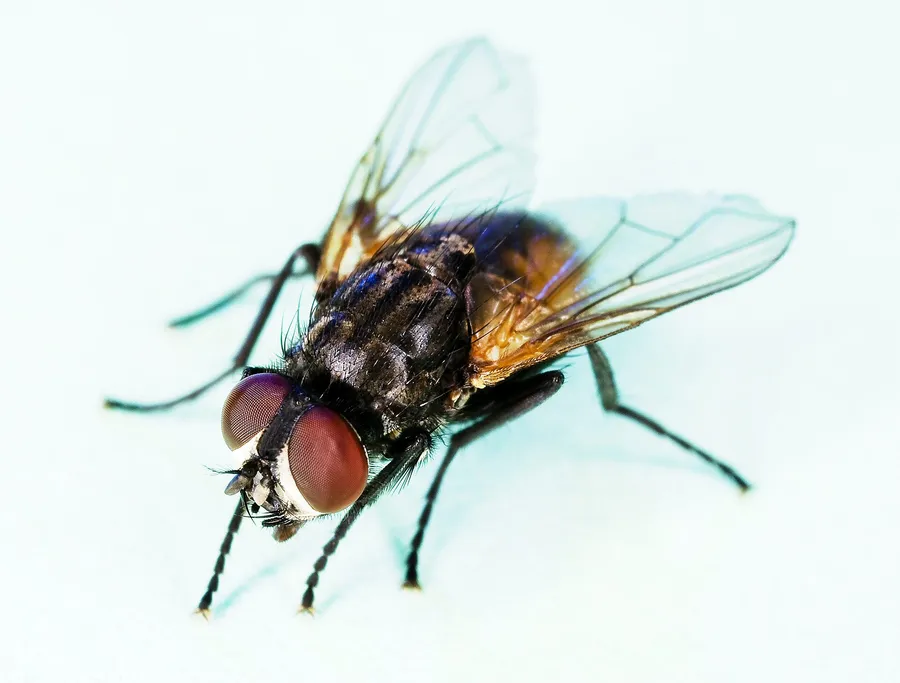
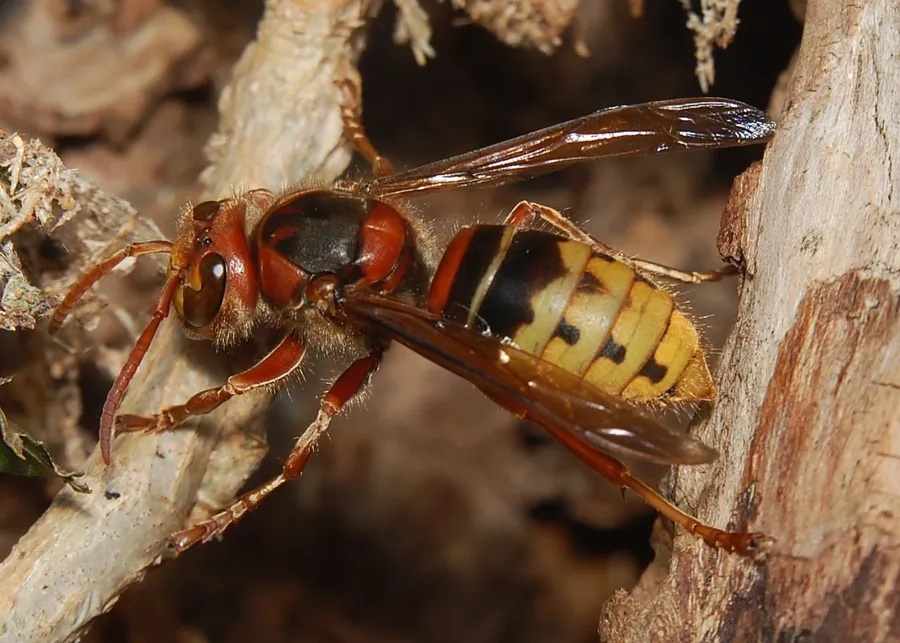
Photo: Common House Fly

Common House Fly

Musca domestica

The housefly is a grey fly six to seven millimetres long, with four dark lengthwise stripes on its thorax. It occurs almost everywhere in the world, usually close to people. Its sponge-like mouthparts soak up liquids, and it softens solid food with saliva; a female lays several hundred eggs in dung, rubbish and rotting matter, on which the maggots feed. Houseflies count as pests because they can carry the germs of diseases such as dysentery, typhoid and salmonellosis.

In our data the species was reported on 4,977 days in 59 countries, most often in Germany, Sweden and the United Kingdom.

Last reported on November 22, 2026 in Panama (Veraguas)

View on the map

Photo: USDAgov, CC BY 2.0

Where the species lives and is reported

Drag to turn the globe

Where it is reported

Most reports come from Europe (81 %), from Asia (10 %) and from North America (5 %).

Counted are reporting days: days on which the species was reported at least once in a cell.

Where it was reported

Each hexagon is a cell about 40 km across in which people reported the species. The darker, the more days.

  • 4,977reporting days
  • 1,177cells
  • 59countries

Where it stays pale, few reports come in. That does not mean the species is absent there. The latest reports pulse:

  • Veraguas, Panama
  • Limón, Costa Rica
  • Coclé, Panama
  • Los Santos, Panama

Where it is reported most often

For each country, the place where the species was reported on the most days. Tap a place.

This is no promise. It shows where people report it especially often.

Through the year

The species is most likely to be reported in January (85 % more often than the yearly average), least often in September (35 % less often). The bars show the difference from the yearly average, adjusted for the fact that more people are outdoors in summer. On the map, a cell is darker the more of its reports fall in the month shown.

January: 85 % more often than the yearly average.

When is the species reported where?

Green means: in this month the species is reported there clearly more often than in the rest of the year. Blue means: clearly less often. We have adjusted for the fact that more people are outdoors in summer. Tap a square.

How often the species is reported per country and month, compared with the yearly average
CountryJFMAMJJASOND
All countriesreported 85 % more often than the yearly averageno clear difference from the yearly averagereported about as often as the yearly averagereported 29 % less often than the yearly averagereported 29 % less often than the yearly averagereported 52 % more often than the yearly averagereported 19 % less often than the yearly averagereported 45 % more often than the yearly averagereported 35 % less often than the yearly averagereported 28 % less often than the yearly averagereported about as often as the yearly averagereported about as often as the yearly average
Germanyreported about as often as the yearly averageno clear difference from the yearly averagereported 26 % less often than the yearly averagereported 43 % less often than the yearly averagereported 49 % less often than the yearly averagereported 2 times as often as the yearly averagereported 44 % less often than the yearly averagereported 2 times as often as the yearly averagereported 47 % less often than the yearly averagereported 47 % less often than the yearly averagereported 39 % less often than the yearly averageno clear difference from the yearly average
Swedenreported 2.7 times as often as the yearly averageno clear difference from the yearly averagereported 2.4 times as often as the yearly averageno clear difference from the yearly averageno clear difference from the yearly averageno clear difference from the yearly averageno clear difference from the yearly averageno clear difference from the yearly averageno clear difference from the yearly averageno clear difference from the yearly averageno clear difference from the yearly averageno clear difference from the yearly average
United Kingdomno clear difference from the yearly averageno clear difference from the yearly averageno clear difference from the yearly averagereported 48 % less often than the yearly averageno clear difference from the yearly averagereported 2.3 times as often as the yearly averageno clear difference from the yearly averagereported about as often as the yearly averageno clear difference from the yearly averagereported 66 % less often than the yearly averageno clear difference from the yearly averageno clear difference from the yearly average
South Koreano clear difference from the yearly averageno clear difference from the yearly averageno clear difference from the yearly averageno clear difference from the yearly averageno clear difference from the yearly averageno clear difference from the yearly averagereported about as often as the yearly averagereported about as often as the yearly averageno clear difference from the yearly averageno clear difference from the yearly averageno clear difference from the yearly averageno clear difference from the yearly average
USAno clear difference from the yearly averageno clear difference from the yearly averageno clear difference from the yearly averageno clear difference from the yearly averageno clear difference from the yearly averagereported about as often as the yearly averageno clear difference from the yearly averagereported about as often as the yearly averageno clear difference from the yearly averagereported 68 % more often than the yearly averagereported 2.6 times as often as the yearly averageno clear difference from the yearly average
Franceno clear difference from the yearly averageno clear difference from the yearly averageno clear difference from the yearly averageno clear difference from the yearly averageno clear difference from the yearly averageno clear difference from the yearly averagereported about as often as the yearly averagereported about as often as the yearly averageno clear difference from the yearly averageno clear difference from the yearly averageno clear difference from the yearly averageno clear difference from the yearly average
Norwayreported 8.5 times as often as the yearly averageno clear difference from the yearly averagereported 2.6 times as often as the yearly averageno clear difference from the yearly averageno clear difference from the yearly averageno clear difference from the yearly averagereported about as often as the yearly averagereported about as often as the yearly averageno clear difference from the yearly averageno clear difference from the yearly averageno clear difference from the yearly averageno clear difference from the yearly average
Russiareported 32.6 times as often as the yearly averageno clear difference from the yearly averageno clear difference from the yearly averageno clear difference from the yearly averageno clear difference from the yearly averagereported 93 % less often than the yearly averagereported 80 % less often than the yearly averagereported 91 % less often than the yearly averageno clear difference from the yearly averageno clear difference from the yearly averageno clear difference from the yearly averageno clear difference from the yearly average
much less oftenless oftenno clear differencemore oftenmuch more often

In Germany in August: reported 2 times as often as the yearly average. This is the strongest month there.

Who is reported in the same cells

In how many of 10 areas of this species the other species was reported as well. Counted are the 422 cells in which this species is reported regularly; compared with the other species that have a page.

Latest reports on the map

The map shows every cell with reports of this species, including the latest ones, and every other species as well.

View the Common House Fly on the map