Where the species is at home
Tinted green are the 10 countries where the species occurs according to the scientific literature, paler the uncertain ones.
Country list: Mammal Diversity Database.
 Wildpulse Map
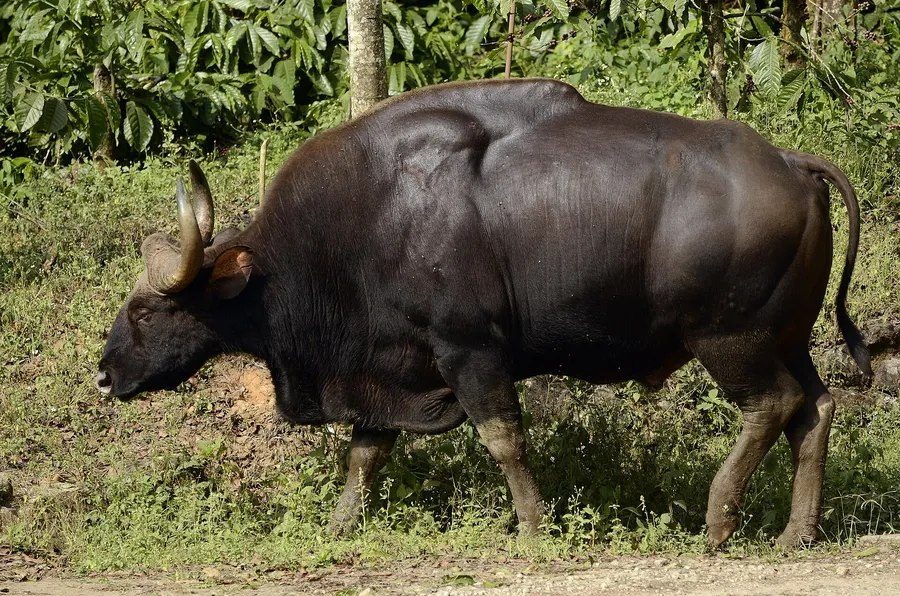
Bos gaurus
The gaur, sometimes called the Indian bison, is the largest of all wild cattle: bulls can stand up to 2.2 metres at the shoulder and weigh more than a tonne. It has a high ridge running along its shoulders and back, and white lower legs that look like stockings. It lives in large, undisturbed forests across the Indian subcontinent and Southeast Asia, grazing and browsing on grasses, leaves and herbs, often at forest edges and clearings. The partly domesticated gayal, or mithun, is descended from it.
In our data the species was reported on 1,375 days in 5 countries, most often in India, Thailand and Myanmar.
Last reported on November 18, 2026 in Thailand (Phetchaburi)
Photo: PJeganathan, CC BY-SA 4.0
The area of each dot matches the weight.
Tinted green are the 10 countries where the species occurs according to the scientific literature, paler the uncertain ones.
Country list: Mammal Diversity Database.
Each hexagon is a cell about 40 km across in which people reported the species. The darker, the more days.
Where it stays pale, few reports come in. That does not mean the species is absent there. The latest reports pulse:
For each country, the place where the species was reported on the most days. Tap a place.
This is no promise. It shows where people report it especially often.
The species is most likely to be reported in June (39 % more often than the yearly average), least often in July. The bars show the difference from the yearly average, adjusted for the fact that more people are outdoors in summer. On the map, a cell is darker the more of its reports fall in the month shown.
January: about as often as the yearly average.
Green means: in this month the species is reported there clearly more often than in the rest of the year. Blue means: clearly less often. We have adjusted for the fact that more people are outdoors in summer. Tap a square.
| J | F | M | A | M | J | J | A | S | O | N | D | |
|---|---|---|---|---|---|---|---|---|---|---|---|---|
| All countries | ||||||||||||
| India | ||||||||||||
| Thailand |
In India in June: reported 43 % more often than the yearly average. This is the strongest month there.
In how many of 10 areas of this species the other species was reported as well. Counted are the 40 cells in which this species is reported regularly; compared with the other species that have a page.
The map shows every cell with reports of this species, including the latest ones, and every other species as well.
View the Gaur on the map