Wildpulse Map
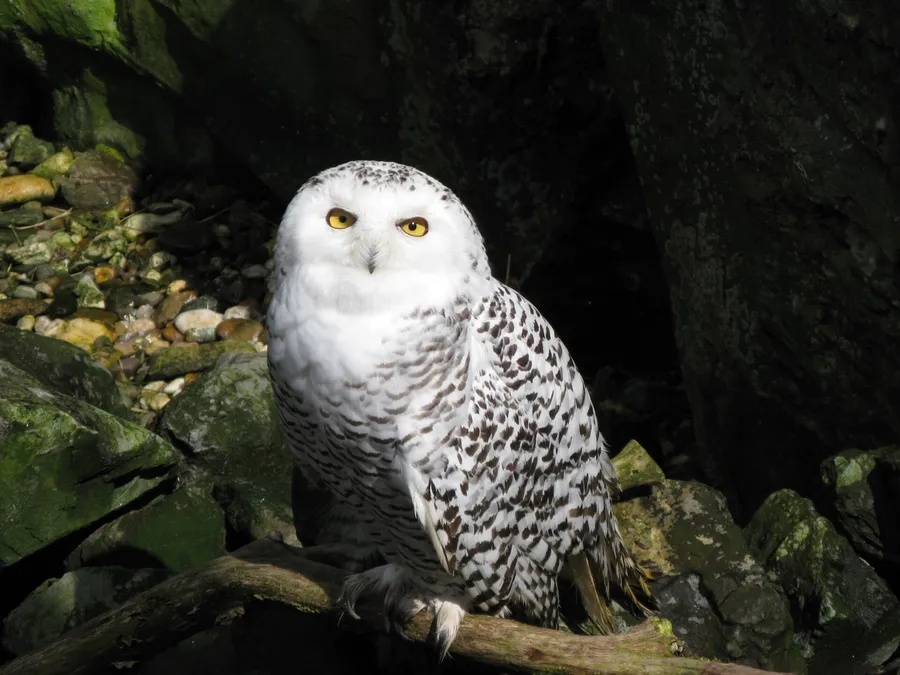
Photo: Snowy Owl

Snowy Owl

Bubo scandiacus

The snowy owl is a large owl of the Arctic tundra with thickly feathered feet; older males are almost pure white, while females and young birds are marked with dark spots and bars. Lemmings are its main prey, and its numbers in an area rise and fall with theirs. Unlike most owls it also hunts in daylight. It nests on a small rise directly on the ground, and in harsh winters some birds move far south, sometimes into the northern United States.

In our data the species was reported on 77,092 days in 19 countries, most often in Canada, the USA and Sweden.

Last reported on September 29, 2026 in Sweden (Dalarna)

View on the map

Photo: julubecka, CC BY-SA 3.0 de

Where the species lives and is reported

Drag to turn the globe

Where it is reported

Most reports come from North America (99 %).

Counted are reporting days: days on which the species was reported at least once in a cell.

Where it was reported

Each hexagon is a cell about 40 km across in which people reported the species. The darker, the more days.

  • 77,092reporting days
  • 2,478cells
  • 19countries

Where it stays pale, few reports come in. That does not mean the species is absent there. The latest reports pulse:

  • Dalarna, Sweden
  • Vermont, USA
  • Michigan, USA
  • Chukotka Autonomous Okrug, Russia

Where it is reported most often

For each country, the place where the species was reported on the most days. Tap a place.

This is no promise. It shows where people report it especially often.

Through the year

The species is most likely to be reported in January (261 % more often than the yearly average), least often in September (96 % less often). The bars show the difference from the yearly average, adjusted for the fact that more people are outdoors in summer. On the map, a cell is darker the more of its reports fall in the month shown.

January: 3.6 times as often as the yearly average.

When is the species reported where?

Green means: in this month the species is reported there clearly more often than in the rest of the year. Blue means: clearly less often. We have adjusted for the fact that more people are outdoors in summer. Tap a square.

How often the species is reported per country and month, compared with the yearly average
CountryJFMAMJJASOND
All countriesreported 3.6 times as often as the yearly averagereported 2.8 times as often as the yearly averagereported 62 % more often than the yearly averagereported 37 % less often than the yearly averagereported 83 % less often than the yearly averagereported 87 % less often than the yearly averagereported 91 % less often than the yearly averagereported 94 % less often than the yearly averagereported 96 % less often than the yearly averagereported 90 % less often than the yearly averagereported about as often as the yearly averagereported 2.9 times as often as the yearly average
Canadareported 3.7 times as often as the yearly averagereported 3.1 times as often as the yearly averagereported 2 times as often as the yearly averagereported 27 % less often than the yearly averagereported 85 % less often than the yearly averagereported 91 % less often than the yearly averagereported 95 % less often than the yearly averagereported 95 % less often than the yearly averagereported 98 % less often than the yearly averagereported 91 % less often than the yearly averagereported 15 % more often than the yearly averagereported 2.8 times as often as the yearly average
USAreported 3.8 times as often as the yearly averagereported 2.7 times as often as the yearly averagereported 37 % more often than the yearly averagereported 47 % less often than the yearly averagereported 83 % less often than the yearly averagereported 84 % less often than the yearly averagereported 88 % less often than the yearly averagereported 94 % less often than the yearly averagereported 95 % less often than the yearly averagereported 91 % less often than the yearly averagereported about as often as the yearly averagereported 3 times as often as the yearly average
Swedenreported 3.1 times as often as the yearly averagereported 3.5 times as often as the yearly averagereported 2.1 times as often as the yearly averageno clear difference from the yearly averagereported 90 % less often than the yearly averagereported 70 % less often than the yearly averagereported 57 % less often than the yearly averagereported 62 % less often than the yearly averagereported 74 % less often than the yearly averageno clear difference from the yearly averagereported 56 % less often than the yearly averageno clear difference from the yearly average
Saint Pierre and Miquelonreported 88 % more often than the yearly averageno clear difference from the yearly averagereported 2.8 times as often as the yearly averageno clear difference from the yearly averageno clear difference from the yearly averagereported 85 % less often than the yearly averageno reportsno reportsno reportsno reportsno clear difference from the yearly averagereported 3.3 times as often as the yearly average
Belgiumreported 2.7 times as often as the yearly averagereported 2.3 times as often as the yearly averagereported about as often as the yearly averageno reportsno reportsno reportsno reportsno reportsno reportsno clear difference from the yearly averageno clear difference from the yearly averagereported 4.2 times as often as the yearly average
Russiareported 3.9 times as often as the yearly averageno clear difference from the yearly averageno clear difference from the yearly averageno clear difference from the yearly averageno reportsno clear difference from the yearly averagereported about as often as the yearly averageno clear difference from the yearly averageno clear difference from the yearly averageno clear difference from the yearly averageno clear difference from the yearly averageno clear difference from the yearly average
Norwayno clear difference from the yearly averagereported 3.2 times as often as the yearly averageno clear difference from the yearly averageno clear difference from the yearly averageno clear difference from the yearly averagereported about as often as the yearly averagereported about as often as the yearly averageno clear difference from the yearly averageno clear difference from the yearly averageno clear difference from the yearly averageno clear difference from the yearly averageno clear difference from the yearly average
People's Republic of Chinano clear difference from the yearly averagereported 2.5 times as often as the yearly averagereported about as often as the yearly averageno clear difference from the yearly averageno clear difference from the yearly averageno clear difference from the yearly averageno clear difference from the yearly averageno clear difference from the yearly averageno clear difference from the yearly averageno clear difference from the yearly averagereported about as often as the yearly averagereported 2.2 times as often as the yearly average
much less oftenless oftenno clear differencemore oftenmuch more often

In Canada in January: reported 3.7 times as often as the yearly average. This is the strongest month there.

Who is reported in the same cells

In how many of 10 areas of this species the other species was reported as well. Counted are the 1,425 cells in which this species is reported regularly; compared with the other species that have a page.

Latest reports on the map

The map shows every cell with reports of this species, including the latest ones, and every other species as well.

View the Snowy Owl on the map