Where it is reported
Most reports come from North America (100 %).
Counted are reporting days: days on which the species was reported at least once in a cell.
 Wildpulse Map
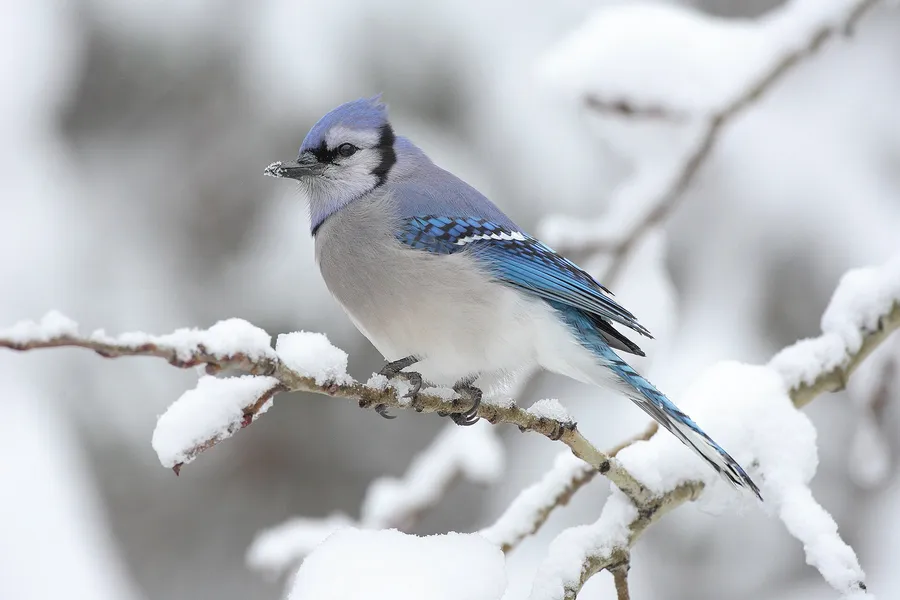
Cyanocitta cristata
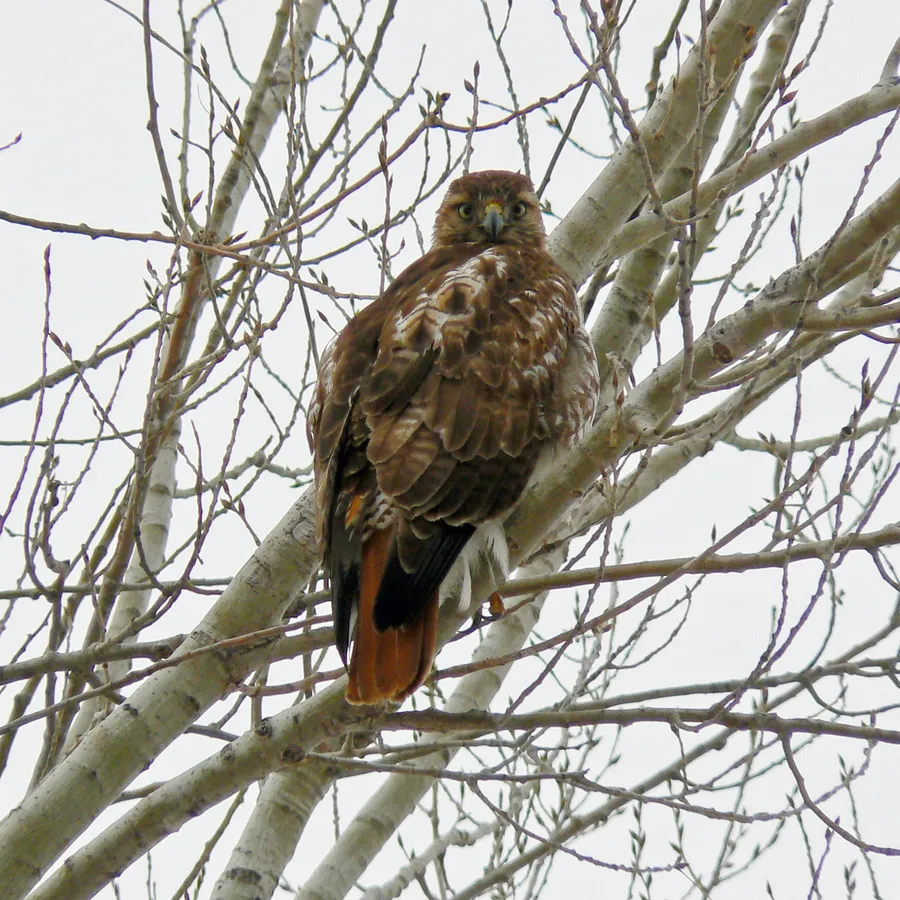
The blue jay is a member of the crow family with a bright blue crest and back, white underparts and a black collar. It lives in eastern and central North America, in deciduous and mixed forests as well as parks and gardens. Most of its diet is acorns, beechnuts and other nuts and seeds, plus insects, and it often hides food in the ground or in tree bark to eat later. Blue jays have a wide range of calls and can even imitate hawks such as the red-tailed hawk.
In our data the species was reported on 4,499,687 days in 4 countries, most often in the USA, Canada and Saint Pierre and Miquelon.
Last reported on November 22, 2026 in the USA (Michigan)
Photo: Mdf, CC BY-SA 3.0
The area of each dot matches the weight.
Most reports come from North America (100 %).
Counted are reporting days: days on which the species was reported at least once in a cell.
Each hexagon is a cell about 40 km across in which people reported the species. The darker, the more days.
Where it stays pale, few reports come in. That does not mean the species is absent there. The latest reports pulse:
For each country, the place where the species was reported on the most days. Tap a place.
This is no promise. It shows where people report it especially often.
The species is most likely to be reported in October (16 % more often than the yearly average), least often in July (14 % less often). The bars show the difference from the yearly average, adjusted for the fact that more people are outdoors in summer. On the map, a cell is darker the more of its reports fall in the month shown.
January: about as often as the yearly average.
Green means: in this month the species is reported there clearly more often than in the rest of the year. Blue means: clearly less often. We have adjusted for the fact that more people are outdoors in summer. Tap a square.
| J | F | M | A | M | J | J | A | S | O | N | D | |
|---|---|---|---|---|---|---|---|---|---|---|---|---|
| All countries | ||||||||||||
| USA | ||||||||||||
| Canada | ||||||||||||
| Saint Pierre and Miquelon |
In the USA in October: reported 15 % more often than the yearly average. This is the strongest month there.
In how many of 10 areas of this species the other species was reported as well. Counted are the 4,158 cells in which this species is reported regularly; compared with the other species that have a page.
The map shows every cell with reports of this species, including the latest ones, and every other species as well.
View the Blue Jay on the map