Wildpulse Map
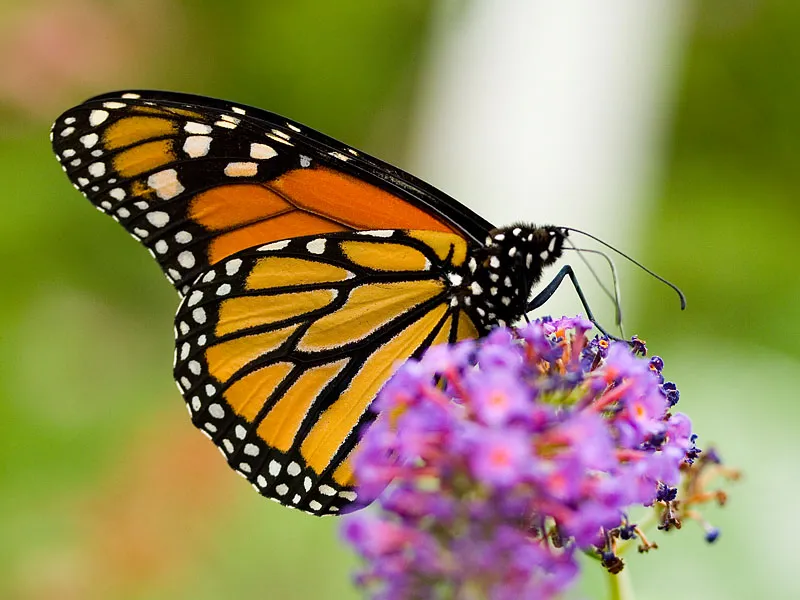
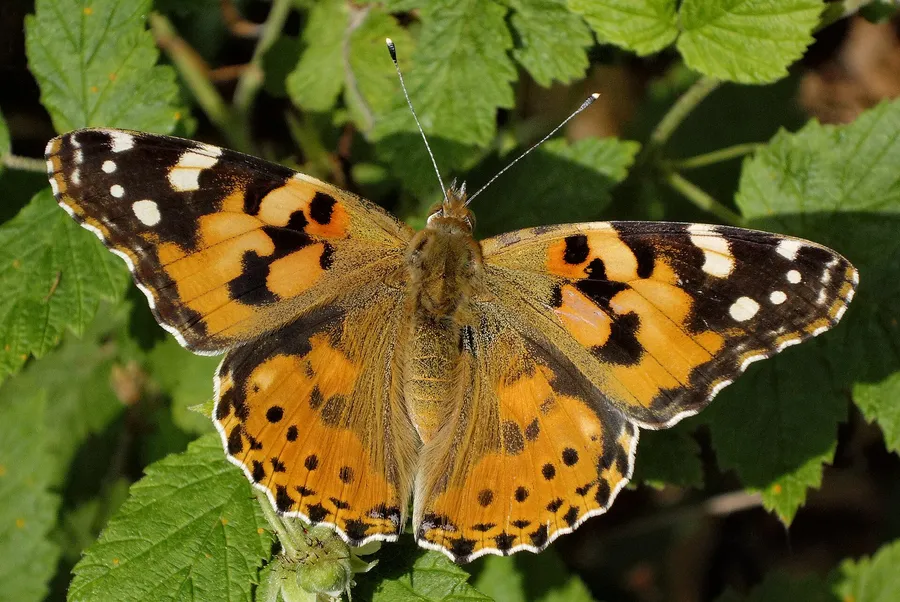
Photo: Monarch Butterfly

Monarch Butterfly

Danaus plexippus

The monarch is a large orange butterfly with black veins and black wing borders dotted with white, and one of the best-known butterflies of North America. Its caterpillars feed on milkweed, taking up toxins that make caterpillars and adults distasteful to many predators. Each autumn, monarchs fly thousands of kilometres from Canada and the United States, eastern ones to Mexico and western ones mainly to coastal California. The return north in spring takes several generations.

In our data the species was reported on 34,139 days in 53 countries, most often in the USA, Canada and Australia.

Last reported on November 21, 2026 in the USA (Texas)

View on the map

Photo: Richiebits, Public domain

Size and way of life

Wingspan
9.0 cmfrom wingtip to wingtip

Where the species lives and is reported

Drag to turn the globe

Where it is reported

Most reports come from North America (90 %) and from Oceania (6 %).

Counted are reporting days: days on which the species was reported at least once in a cell.

Where it was reported

Each hexagon is a cell about 40 km across in which people reported the species. The darker, the more days.

  • 34,139reporting days
  • 2,860cells
  • 53countries

Where it stays pale, few reports come in. That does not mean the species is absent there. The latest reports pulse:

  • Texas, USA
  • Ontario, Canada
  • Louisiana, USA
  • Tamaulipas, Mexico

Where it is reported most often

For each country, the place where the species was reported on the most days. Tap a place.

This is no promise. It shows where people report it especially often.

Through the year

The species is most likely to be reported in August (58 % more often than the yearly average), least often in May (54 % less often). The bars show the difference from the yearly average, adjusted for the fact that more people are outdoors in summer. On the map, a cell is darker the more of its reports fall in the month shown.

January: 39 % more often than the yearly average.

When is the species reported where?

Green means: in this month the species is reported there clearly more often than in the rest of the year. Blue means: clearly less often. We have adjusted for the fact that more people are outdoors in summer. Tap a square.

How often the species is reported per country and month, compared with the yearly average
CountryJFMAMJJASOND
All countriesreported 39 % more often than the yearly averagereported 39 % less often than the yearly averagereported 43 % less often than the yearly averagereported 44 % less often than the yearly averagereported 54 % less often than the yearly averagereported 41 % less often than the yearly averagereported 21 % more often than the yearly averagereported 58 % more often than the yearly averagereported 54 % more often than the yearly averagereported 25 % more often than the yearly averagereported 16 % less often than the yearly averagereported 31 % less often than the yearly average
USAreported 2.2 times as often as the yearly averagereported 44 % less often than the yearly averagereported 51 % less often than the yearly averagereported 47 % less often than the yearly averagereported 56 % less often than the yearly averagereported 48 % less often than the yearly averagereported about as often as the yearly averagereported 50 % more often than the yearly averagereported 59 % more often than the yearly averagereported 47 % more often than the yearly averagereported about as often as the yearly averagereported 24 % less often than the yearly average
Canadareported about as often as the yearly averageno reportsno reportsreported 99 % less often than the yearly averagereported 87 % less often than the yearly averagereported 42 % less often than the yearly averagereported 46 % more often than the yearly averagereported 72 % more often than the yearly averagereported 35 % more often than the yearly averagereported 59 % less often than the yearly averagereported 79 % less often than the yearly averagereported 91 % less often than the yearly average
Australiareported about as often as the yearly averagereported about as often as the yearly averagereported about as often as the yearly averageno clear difference from the yearly averageno clear difference from the yearly averagereported 53 % more often than the yearly averagereported 62 % more often than the yearly averageno clear difference from the yearly averageno clear difference from the yearly averagereported 31 % less often than the yearly averageno clear difference from the yearly averageno clear difference from the yearly average
New Zealandno clear difference from the yearly averageno clear difference from the yearly averageno clear difference from the yearly averagereported 52 % more often than the yearly averageno clear difference from the yearly averagereported 56 % more often than the yearly averagereported 59 % more often than the yearly averageno clear difference from the yearly averageno clear difference from the yearly averagereported 36 % less often than the yearly averagereported 60 % less often than the yearly averagereported 31 % less often than the yearly average
Spainreported 2.1 times as often as the yearly averageno clear difference from the yearly averageno clear difference from the yearly averagereported 49 % less often than the yearly averageno clear difference from the yearly averagereported 43 % less often than the yearly averagereported about as often as the yearly averagereported 53 % less often than the yearly averagereported 42 % less often than the yearly averagereported about as often as the yearly averagereported 71 % more often than the yearly averagereported 3.3 times as often as the yearly average
Mexicono clear difference from the yearly averageno clear difference from the yearly averageno clear difference from the yearly averageno clear difference from the yearly averageno clear difference from the yearly averagereported 62 % less often than the yearly averagereported 61 % less often than the yearly averagereported 65 % less often than the yearly averageno clear difference from the yearly averageno clear difference from the yearly averagereported 2.5 times as often as the yearly averagereported 61 % more often than the yearly average
Colombiano clear difference from the yearly averagereported about as often as the yearly averageno clear difference from the yearly averageno clear difference from the yearly averagereported 76 % more often than the yearly averageno clear difference from the yearly averageno clear difference from the yearly averagereported about as often as the yearly averageno clear difference from the yearly averageno clear difference from the yearly averageno clear difference from the yearly averageno clear difference from the yearly average
Portugalreported 2.3 times as often as the yearly averageno clear difference from the yearly averageno clear difference from the yearly averageno clear difference from the yearly averageno clear difference from the yearly averageno clear difference from the yearly averageno clear difference from the yearly averageno clear difference from the yearly averageno clear difference from the yearly averagereported about as often as the yearly averageno clear difference from the yearly averageno clear difference from the yearly average
much less oftenless oftenno clear differencemore oftenmuch more often

In the USA in January: reported 2.2 times as often as the yearly average. This is the strongest month there.

Who is reported in the same cells

In how many of 10 areas of this species the other species was reported as well. Counted are the 1,451 cells in which this species is reported regularly; compared with the other species that have a page.

Latest reports on the map

The map shows every cell with reports of this species, including the latest ones, and every other species as well.

View the Monarch Butterfly on the map